Proctor and Gamble 2003 Annual Report Download - page 5
Download and view the complete annual report
Please find page 5 of the 2003 Proctor and Gamble annual report below. You can navigate through the pages in the report by either clicking on the pages listed below, or by using the keyword search tool below to find specific information within the annual report.-
 1
1 -
 2
2 -
 3
3 -
 4
4 -
 5
5 -
 6
6 -
 7
7 -
 8
8 -
 9
9 -
 10
10 -
 11
11 -
 12
12 -
 13
13 -
 14
14 -
 15
15 -
 16
16 -
17
-
18
-
19
-
20
-
21
-
22
-
23
-
24
-
25
-
26
-
27
-
28
-
29
-
30
-
31
-
32
-
33
-
34
-
35
-
36
-
37
-
38
-
39
-
40
-
41
-
42
-
43
-
44
-
45
-
46
-
47
-
48
-
49
-
50
-
51
-
52
-
53
-
54
-
55
-
56
-
57
-
58
-
59
-
60
 |
 |
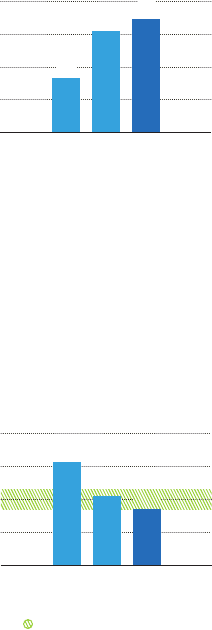
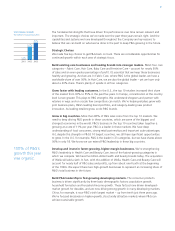
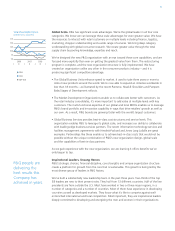
Free Cash Flow
(in billions of dollars)
2001 2002 2003
7.2
3.3
6.1
P&G’s strategic choices are working. We have continued opportunities for substantial growth
in every strategic area. We will stay the strategic course.
Cost and Cash Management
The next plank of P&G’s sustained growth strategy is a relentless focus on productivity, cost
reduction and cash management.
• Over the last three years, we’ve generated nearly $17 billion in free cash flow, which is
cash flow from operations less capital spending. This is two-and-a-half times the amount
generated in the previous three years and more than enough to fund dividend growth,
share repurchases and acquisitions such as Clairol and Wella.
• We’ve delivered substantial operating margin progress, excluding restructuring charges.
We’ve been disciplined and delivered both restructuring savings and other structural
cost improvements.
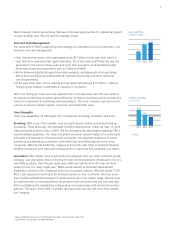
• In the past three years, we’ve reduced annual capital spending by $1.5 billion – without
foregoing any strategic investments in capacity or innovation.
We’re not letting up. There are more opportunities in virtually every area. We will continue
to improve productivity, to spend capital efficiently, to reduce inventories and to increase the
return on investments in marketing and new products. We must conserve cash and control
costs to continue to deliver superior consumer and shareholder value.
Core Strengths
Three core capabilities set P&G apart from competition: branding, innovation and scale.
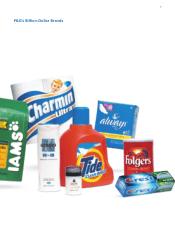
Branding. P&G is one of the world’s most successful brand-creation and brand-building
companies. Three years ago, we marketed 10 billion-dollar brands. Today, we have 13, with
Olay joining this exclusive club in 2003. We are leveraging the advantages created by P&G’s
brand-building capabilities. Our deep and global consumer research helps us to understand,
anticipate and respond to consumer needs and wants. Our expertise enables us to create
marketing and advertising innovations more effectively and efficiently than many other
companies. P&G’s brand leadership, category and country scale helps us implement brand-
building innovations with retail and media partners in ways that few companies can match.
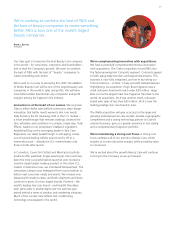
Innovation. P&G creates more new brands and categories than any other consumer goods
company. Last year alone, three of the top 10 new non-food products introduced in the U.S.
were P&G products. Over the past eight years, P&G has had the #1 or #2 new non-food
product in the U.S. every single year.1 P&G’s brand-creation and product development
leadership is driven by the Company’s enormous innovative capacity. We have nearly 7,500
Ph.D.s and researchers working in 20 technical centers on four continents. We have more
than 29,000 patented technologies for products that are in the market today. We are more
focused than ever on turning patents into products that consumers buy and use every day.
We’re multiplying this capability by collaborating more extensively with external innovation
partners. The vision is that 50% of all P&G discovery and invention will come from outside
the Company.
3
1
Source: Information Resources, Inc. New Product Pacesetters Annual Reports, Dollar Sales,
top FDMx Non-Food products (excludes Wal-Mart)
Capital Spending
(as % of sales)
2001 2002 2003
3.4%
6.3%
4.2%
Goal