Proctor and Gamble 2003 Annual Report Download - page 37
Download and view the complete annual report
Please find page 37 of the 2003 Proctor and Gamble annual report below. You can navigate through the pages in the report by either clicking on the pages listed below, or by using the keyword search tool below to find specific information within the annual report.-
 1
1 -
2
-
3
-
4
-
5
-
6
-
7
-
8
-
9
-
10
-
11
-
12
-
13
-
14
-
15
-
16
-
17
-
18
-
19
-
20
-
21
-
22
-
23
-
24
-
25
-
26
-
 27
27 -
 28
28 -
 29
29 -
 30
30 -
 31
31 -
 32
32 -
 33
33 -
 34
34 -
 35
35 -
 36
36 -
 37
37 -
 38
38 -
 39
39 -
 40
40 -
 41
41 -
 42
42 -
 43
43 -
 44
44 -
 45
45 -
 46
46 -
 47
47 -
48
-
49
-
50
-
51
-
52
-
53
-
54
-
55
-
56
-
57
-
58
-
59
-
60
 |
 |

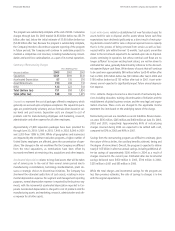
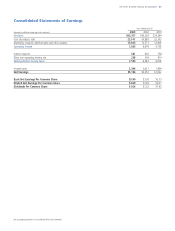
Consolidated Statements of Earnings
35The Procter & Gamble Company and Subsidiaries
Years Ended June 30
2001
$39,244
22,102
12,406
4,736
794
674
4,616
1,694
$2,922
$2.15
$2.07
$1.40
2002
$40,238
20,989
12,571
6,678
603
308
6,383
2,031
$4,352
$3.26
$3.09
$1.52
2003
$43,377
22,141
13,383
7,853
561
238
7,530
2,344
$5,186
$3.90
$3.69
$1.64
Net Sales
Cost of products sold
Marketing, research, administrative and other expense
Operating Income
Interest expense
Other non-operating income, net
Earnings Before Income Taxes
Income taxes
Net Earnings
Basic Net Earnings Per Common Share
Diluted Net Earnings Per Common Share
Dividends Per Common Share
Amounts in millions except per share amounts
See accompanying Notes to Consolidated Financial Statements