Proctor and Gamble 2002 Annual Report Download - page 47
Download and view the complete annual report
Please find page 47 of the 2002 Proctor and Gamble annual report below. You can navigate through the pages in the report by either clicking on the pages listed below, or by using the keyword search tool below to find specific information within the annual report.-
 1
1 -
2
-
3
-
4
-
5
-
6
-
7
-
8
-
9
-
10
-
11
-
12
-
13
-
14
-
15
-
16
-
17
-
18
-
19
-
20
-
21
-
22
-
23
-
24
-
25
-
26
-
27
-
28
-
29
-
30
-
31
-
32
-
33
-
34
-
35
-
36
-
 37
37 -
 38
38 -
 39
39 -
 40
40 -
 41
41 -
 42
42 -
 43
43 -
 44
44 -
 45
45 -
 46
46 -
 47
47 -
 48
48 -
 49
49 -
 50
50 -
 51
51 -
 52
52
 |
 |

45The Procter & Gamble Company and Subsidiaries
Notes to Consolidated Financial Statements
Millions of dollars except per share amounts
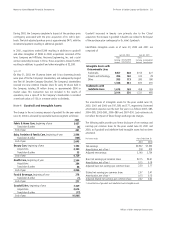
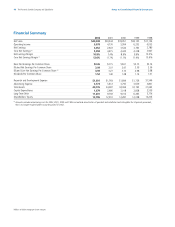
$40,238
39,244
6,678
4,736
4,352
2,922
5,058
4,615
3.09
2.07
3.59
3.27
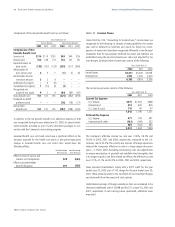
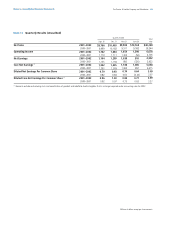
Net Sales
Operating Income
Net Earnings
Core Net Earnings (1)
Diluted Net Earnings Per Common Share
Diluted Core Net Earnings Per Common Share (1)
2001–2002
2000–2001
2001–2002
2000–2001
2001–2002
2000–2001
2001–2002
2000–2001
2001–2002
2000–2001
2001–2002
2000–2001
$9,766
9,969
1,762
1,779
1,104
1,155
1,342
1,293
0.79
0.82
0.96
0.92
$10,403
10,182
1,864
1,711
1,299
1,194
1,445
1,369
0.93
0.84
1.03
0.97
$9,900
9,511
1,654
1,302
1,039
893
1,186
1,062
0.74
0.63
0.84
0.75
$10,169
9,582
1,398
(56)
910
(320)
1,085
891
0.64
(0.23)
0.77
0.63
Quarters Ended
Sept. 30
(1) Amounts exclude restructuring costs and amortization of goodwill and indefinite-lived intangibles that is no longer required under accounting rules for 2002.
Total
Year
Note 14 Quarterly Results (Unaudited)
June 30
Mar. 31Dec. 31