Proctor and Gamble 2002 Annual Report Download - page 38
Download and view the complete annual report
Please find page 38 of the 2002 Proctor and Gamble annual report below. You can navigate through the pages in the report by either clicking on the pages listed below, or by using the keyword search tool below to find specific information within the annual report.-
 1
1 -
2
-
3
-
4
-
5
-
6
-
7
-
8
-
9
-
10
-
11
-
12
-
13
-
14
-
15
-
16
-
17
-
18
-
19
-
20
-
21
-
22
-
23
-
24
-
25
-
26
-
27
-
 28
28 -
 29
29 -
 30
30 -
 31
31 -
 32
32 -
 33
33 -
 34
34 -
 35
35 -
 36
36 -
 37
37 -
 38
38 -
 39
39 -
 40
40 -
 41
41 -
 42
42 -
 43
43 -
 44
44 -
 45
45 -
 46
46 -
 47
47 -
 48
48 -
49
-
50
-
51
-
52
 |
 |
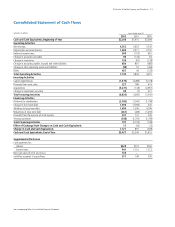
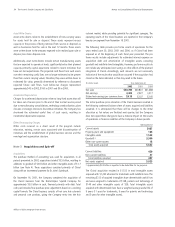
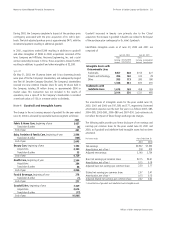
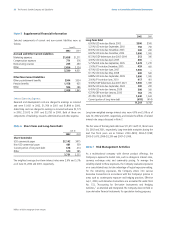
36 The Procter & Gamble Company and Subsidiaries
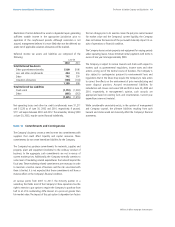
Note 5 Supplemental Financial Information
Selected components of current and non-current liabilities were as
follows:
Selected Operating Expenses
Research and development costs are charged to earnings as incurred
and were $1,601 in 2002, $1,769 in 2001 and $1,899 in 2000.
Advertising costs are charged to earnings as incurred and were $3,773
in 2002, $3,612 in 2001 and $3,793 in 2000. Both of these are
components of marketing, research, administrative and other expense.
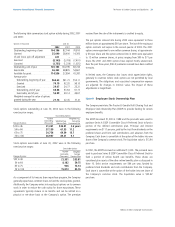
Note 6 Short-Term and Long-Term Debt
The weighted average short-term interest rates were 2.9% and 5.3%
as of June 30, 2002 and 2001, respectively.
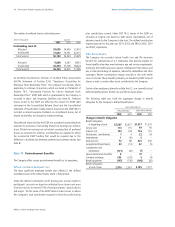
Long-term weighted average interest rates were 4.0% and 5.0% as of
June 30, 2002 and 2001, respectively, and include the effects of related
interest rate swaps discussed in Note 7.
The fair value of the long-term debt was $11,673 and $10,164 at June
30, 2002 and 2001, respectively. Long-term debt maturities during the
next five fiscal years are as follows: 2003–$618; 2004–$1,099;
2005–$1,475; 2006–$2,200 and 2007–$1,006.
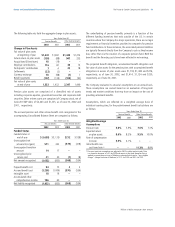
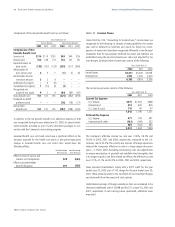
Note 7 Risk Management Activities
As a multinational company with diverse product offerings, the
Company is exposed to market risks, such as changes in interest rates,
currency exchange rates and commodity pricing. To manage the
volatility related to these exposures, the Company evaluates exposures
on a consolidated basis to take advantage of logical exposure netting.
For the remaining exposures, the Company enters into various
derivative transactions in accordance with the Company’s policies in
areas such as counterparty exposure and hedging practices. Effective
July 1, 2000, such derivative transactions are accounted for under SFAS
No. 133, ”Accounting for Derivative Instruments and Hedging
Activities,“ as amended and interpreted. The Company does not hold or
issue derivative financial instruments for speculative trading purposes.
2002
Long-Term Debt
6.00% USD note due March, 2003
5.25% USD note due September, 2003
8.00% USD note due November, 2003
6.60% USD note due December, 2004
8.33% ESOP debentures due 2003-2004
4.00% USD note due April, 2005
5.75% EUR note due September, 2005
1.50% JPY note due December, 2005
4.75% USD note due June, 2007
6.13% USD note due May, 2008
6.88% USD note due September, 2009
2.00% JPY note due June, 2010
9.36% ESOP debentures due 2007-2021
8.00% USD note due September, 2024
6.45% USD note due January, 2026
6.25% GBP note due January, 2030
All other long-term debt
Current portion of long-term debt
$500
750
200
1,000
212
400
1,478
459
1,000
500
1,000
417
1,000
200
300
763
1,640
(618)
11,201
$500
750
200
1,000
306
–
1,270
441
–
500
1,000
401
1,000
200
300
705
1,633
(414)
9,792
Notes to Consolidated Financial Statements
Millions of dollars except per share amounts
Accrued and Other Current Liabilities
Marketing expenses
Compensation expenses
Restructuring reserves
Other
Other Non-Current Liabilities
Other postretirement benefits
Pension benefits
Other
June 30
2002
$1,658
771
245
2,656
5,330
$344
1,158
586
2,088
$1,271
576
460
2,324
4,631
$534
925
386
1,845
2001
2002
Short-Term Debt
USD commercial paper
Non-USD commercial paper
Current portion of long-term debt
Other
$2,142
461
618
510
3,731
$675
559
414
585
2,233
June 30
2001
2001