Proctor and Gamble 2002 Annual Report Download - page 21
Download and view the complete annual report
Please find page 21 of the 2002 Proctor and Gamble annual report below. You can navigate through the pages in the report by either clicking on the pages listed below, or by using the keyword search tool below to find specific information within the annual report.-
 1
1 -
2
-
3
-
4
-
5
-
6
-
7
-
8
-
9
-
10
-
 11
11 -
 12
12 -
 13
13 -
 14
14 -
 15
15 -
 16
16 -
 17
17 -
 18
18 -
 19
19 -
 20
20 -
 21
21 -
 22
22 -
 23
23 -
 24
24 -
 25
25 -
 26
26 -
 27
27 -
 28
28 -
 29
29 -
 30
30 -
 31
31 -
32
-
33
-
34
-
35
-
36
-
37
-
38
-
39
-
40
-
41
-
42
-
43
-
44
-
45
-
46
-
47
-
48
-
49
-
50
-
51
-
52
 |
 |
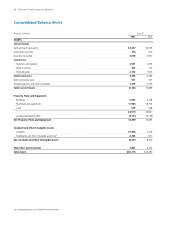
Financial Review 19The Procter & Gamble Company and Subsidiaries
2001. This increase is indicative of the heightened emphasis
on cash generation the Company has placed on all of its
operating units. Free cash flow was $3.32 billion in 2001 and
$1.66 billion in 2000.
The Company continues to generate strong cash flow from
operations. In 2002, cash flow from operations was $7.74
billion, up $1.94 billion from $5.80 billion in 2001, which
was an increase of $1.12 billion from $4.68 billion in 2000.
Higher earnings were the primary contributor. In addition,
taxes payable increased approximately $500 million versus
the prior year, primarily driven by utilization of prior year
overpayments and deferred tax assets. Depreciation and
amortization charges declined by $578 million versus the
prior year. Of this decrease, $235 million is attributable to
the adoption of Statement of Financial Accounting Standards
(SFAS) No. 142, under which goodwill and indefinite-lived
intangible assets are no longer being amortized. The
remaining decline is primarily driven by lower accelerated
depreciation from the restructuring program in fiscal 2002
versus 2001.
Net cash used for acquisitions completed during 2002 to-
taled $5.47 billion, primarily driven by the Clairol acquisition.
This compares to $138 million in 2001 and $2.97 billion in
2000, which included the Iams and PUR acquisitions.
The Company continues to divest certain non-strategic
brands in order to focus resources on core businesses. The
divestitures declined significantly in the current year,
returning to historical levels. The proceeds from these and
other asset sales generated $227 million in cash flow in the
current year, which is significantly reduced when compared
to the $788 million generated in 2001 and $419 million
generated in 2000.
The Company maintains a share repurchase program, which
authorizes the purchase of shares annually on the open
market. A primary purpose of the program is to mitigate the
dilutive impact of stock option grants – effectively pre-
funding the exercise obligation. Additionally, there is a
discretionary component under which it may repurchase
additional outstanding shares. Current year purchases under
the combined programs were $568 million, compared to
$1.25 billion in 2001 and $1.77 billion in 2000. The decline in
the current year is primarily due to cash requirements associ-
ated with the Clairol acquisition. The Company anticipates
the buy-back program will return to historical levels in 2003.
Common share dividends grew 9% to $1.52 per share in
2002 versus $1.40 in 2001 and $1.28 in 2000. The annual
dividend rate will increase to $1.64 per common share in
2003, marking the 47th consecutive year of increased
common share dividend payments. Total dividend payments,
to both common and preferred shareholders, were $2.10
billion, $1.94 billion and $1.80 billion in 2002, 2001 and
2000, respectively.
Total debt increased $2.91 billion to $14.93 billion compared
to $12.02 billion in 2001 and $12.25 billion in 2000. This
increase was primarily driven by the Clairol acquisition –
which had a purchase price of approximately $5.00 billion.
Long-term borrowing available under the Company’s current
shelf registration statement filed in March 2002 was $4.00
billion at June 30, 2002. Additionally, the Company is able to
issue commercial paper at favorable rates and to access
general bank financing.
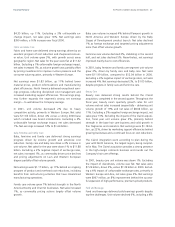
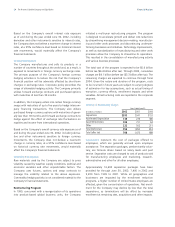
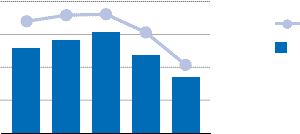
Capital Spending
Capital spending efficiency has been a focus area for the
Company. Spending decreased $807 million to $1.68 billion
in 2002, compared to $2.49 billion in 2001 and $3.02 billion
in 2000. Current year spending is 4.2% of net sales, com-
pared to 6.3% and 7.6% in 2001 and 2000, respectively.
This current year reduction of more than $800 million versus
the prior year surpasses the Company’s 6% of net sales goal
two years earlier than originally anticipated. This improve-
ment in capital spending is the result of three main factors: 1)
completing the majority of the re-platforming and capacity
expansion investment in the baby, feminine and family care
business unit, 2) sourcing consolidation and improved capaci-
ty utilization; and, 3) increasing emphasis on reduced but sus-
tainable capital spending levels to improve shareholder value.
Liquidity
The Company does not have off-balance sheet arrangements,
1998
0
1999 2000 2001 2002
2
1
3
$4
0%
4%
2%
6%
8%
% of Net Sales
Capital Spending
Capital Spending
(in billions of dollars)