Proctor and Gamble 2002 Annual Report Download - page 19
Download and view the complete annual report
Please find page 19 of the 2002 Proctor and Gamble annual report below. You can navigate through the pages in the report by either clicking on the pages listed below, or by using the keyword search tool below to find specific information within the annual report.-
 1
1 -
2
-
3
-
4
-
5
-
6
-
7
-
8
-
 9
9 -
 10
10 -
 11
11 -
 12
12 -
 13
13 -
 14
14 -
 15
15 -
 16
16 -
 17
17 -
 18
18 -
 19
19 -
 20
20 -
 21
21 -
 22
22 -
 23
23 -
 24
24 -
 25
25 -
 26
26 -
 27
27 -
 28
28 -
 29
29 -
30
-
31
-
32
-
33
-
34
-
35
-
36
-
37
-
38
-
39
-
40
-
41
-
42
-
43
-
44
-
45
-
46
-
47
-
48
-
49
-
50
-
51
-
52
 |
 |
Financial Review
Results of Operations
The Company’s fiscal year ended June 30, 2002 reflects the
benefits of clear strategic choices, operational excellence and
financial discipline. The Company kept its commitment to
deliver consistent, reliable earnings and cash growth. In fact,
it delivered its long-term sales and earnings growth targets
ahead of the established objective and substantially
increased free cash flow.
During 2002, the Company completed the acquisition and
integration of Clairol – its largest acquisition ever – providing a
strong presence in the high-margin hair colorants business. It
also divested Comet and spun off Jif and Crisco. These trans-
actions are part of the Company’s choice to focus on building
big brands that offer the greatest potential for global growth.
The Company continues to make clear choices about where
to play and how to win. The framework for these is
grounded in focus areas that include: building core catego-
ries and leading brands; growing with the biggest retail
customers in the biggest geographic markets; and investing
in faster-growing, higher-margin, more asset-efficient
businesses. This requires some difficult decisions, including
those reflected in the Company’s restructuring program to
reduce overheads and streamline manufacturing and other
work processes. As the fiscal year results demonstrate, these
strategic choices are paying off.
Volume and Net Sales
Record sales in 2002 of $40.24 billion exceeded 2001 sales by
$994 million, or 3%. Excluding an unfavorable exchange rate
impact of 1% in the current year, net sales grew 4%. Core
net sales, which exclude restructuring impacts, were $40.17
billion, up 2% versus $39.38 billion in 2001. Excluding an
unfavorable exchange rate impact of 2% in the current year,
core net sales grew 4%. This is in line with the Company’s
long-term objective of 4% to 6% sales growth, excluding
the impacts of foreign exchange. Sales growth in 2002 was
driven by 7% unit volume growth – with particularly strong
performances in the health care and beauty care segments.
Fiscal year 2001 sales were $39.24 billion compared to
$39.95 billion in 2000. Excluding unfavorable exchange
effects of 3%, sales increased 2%, reflecting improved
pricing in beauty care, fabric and home care and baby,
feminine and family care. Unit volume was flat in 2001, as
exceptionally strong performance by new businesses in
health care was offset by softness in food and beverage.
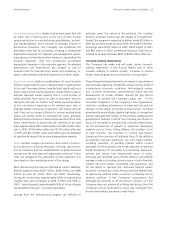
Net Earnings
In 2002, net earnings were $4.35 billion, compared to $2.92
billion in 2001 and $3.54 billion in 2000. Reported results
include after-tax restructuring charges of $706 million,
$1,475 million, and $688 million in 2002, 2001 and 2000,
respectively. This restructuring program covers a significant
reduction in enrollment, manufacturing consolidations
and portfolio choices to scale back or discontinue under-
performing businesses and initiatives.
The Company’s long-term earnings goal is to consistently
deliver double-digit core net earnings per share growth. Core
diluted net earnings per share, which excludes the impact of
restructuring charges and the prior years’ amortization of
goodwill and indefinite-lived intangibles, increased 10% to
$3.59 in 2002. This compares to core diluted net earnings
per share of $3.27 in 2001 and $3.10 in 2000. The goodwill
adjustment was $0.15 per share in both 2001 and 2000. In
the current year, every business unit delivered net earnings
growth above the corporate objective. Clear strategic focus
and operational excellence are enabling improved business
performance across all fronts. Core diluted net earnings per
share growth in the prior year of 5% reflected cost increases
and exchange impacts, which were mitigated by pricing
improvements, lower taxes and divestiture gains.
Operating Costs
Costs of products sold was $20.99 billion in 2002, compared
to $22.10 billion in 2001 and $21.51 billion in 2000. Restruc-
turing costs included in cost of products sold were $508 mil-
lion in 2002, $1.14 billion in 2001, and $496 million in 2000.
Excluding restructuring charges, as a percent of core net sales,
cost of products sold was 51.0% in 2002, compared to
53.2% in 2001 and 52.6% in 2000. The progress in the cur-
rent year reflects a decline in material costs and a continued
focus on savings projects, including restructuring. Gross
margin progress accelerated throughout the year, as restruc-
turing benefits and ongoing operational savings increased.
17The Procter & Gamble Company and Subsidiaries
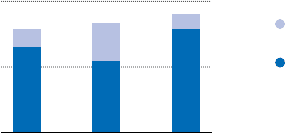
2000
0
2001 2002
2
$4
Net Earnings Per Share
(on a diluted basis)
Core Earnings
Per Share
Reported
Earnings
Per Share