Proctor and Gamble 2002 Annual Report Download - page 31
Download and view the complete annual report
Please find page 31 of the 2002 Proctor and Gamble annual report below. You can navigate through the pages in the report by either clicking on the pages listed below, or by using the keyword search tool below to find specific information within the annual report.-
 1
1 -
2
-
3
-
4
-
5
-
6
-
7
-
8
-
9
-
10
-
11
-
12
-
13
-
14
-
15
-
16
-
17
-
18
-
19
-
20
-
 21
21 -
 22
22 -
 23
23 -
 24
24 -
 25
25 -
 26
26 -
 27
27 -
 28
28 -
 29
29 -
 30
30 -
 31
31 -
 32
32 -
 33
33 -
 34
34 -
 35
35 -
 36
36 -
 37
37 -
 38
38 -
 39
39 -
 40
40 -
 41
41 -
42
-
43
-
44
-
45
-
46
-
47
-
48
-
49
-
50
-
51
-
52
 |
 |

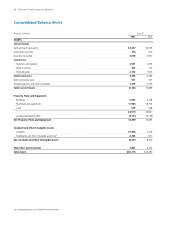
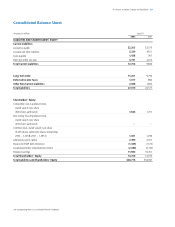
29The Procter & Gamble Company and Subsidiaries
Consolidated Balance Sheet
$2,205
5,330
1,438
3,731
12,704
11,201
1,077
2,088
27,070
1,634
–
1,301
2,490
(1,339)
(2,360)
11,980
13,706
$40,776
$2,075
4,631
907
2,233
9,846
9,792
894
1,845
22,377
1,701
–
1,296
2,057
(1,375)
(2,120)
10,451
12,010
$34,387
June 30
Amounts in millions
LIABILITIES AND SHAREHOLDERS’ EQUITY
Current Liabilities
Accounts payable
Accrued and other liabilities
Taxes payable
Debt due within one year
Total Current Liabilities
Long-Term Debt
Deferred Income Taxes
Other Non-Current Liabilities
Total Liabilities
Shareholders’ Equity
Convertible Class A preferred stock,
stated value $1 per share
(600 shares authorized)
Non-Voting Class B preferred stock,
stated value $1 per share
(200 shares authorized)
Common stock, stated value $1 per share
(5,000 shares authorized; shares outstanding:
2002 – 1,300.8, 2001 – 1,295.7)
Additional paid-in capital
Reserve for ESOP debt retirement
Accumulated other comprehensive income
Retained earnings
Total Shareholders’ Equity
Total Liabilities and Shareholders’ Equity
2002 2001
See accompanying Notes to Consolidated Financial Statements