Proctor and Gamble 2002 Annual Report Download - page 22
Download and view the complete annual report
Please find page 22 of the 2002 Proctor and Gamble annual report below. You can navigate through the pages in the report by either clicking on the pages listed below, or by using the keyword search tool below to find specific information within the annual report.-
 1
1 -
2
-
3
-
4
-
5
-
6
-
7
-
8
-
9
-
10
-
11
-
 12
12 -
 13
13 -
 14
14 -
 15
15 -
 16
16 -
 17
17 -
 18
18 -
 19
19 -
 20
20 -
 21
21 -
 22
22 -
 23
23 -
 24
24 -
 25
25 -
 26
26 -
 27
27 -
 28
28 -
 29
29 -
 30
30 -
 31
31 -
 32
32 -
33
-
34
-
35
-
36
-
37
-
38
-
39
-
40
-
41
-
42
-
43
-
44
-
45
-
46
-
47
-
48
-
49
-
50
-
51
-
52
 |
 |
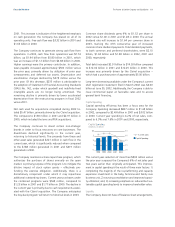
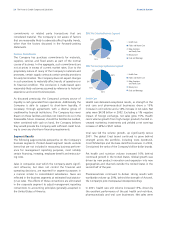
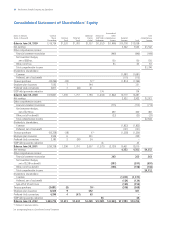
2002 Net Sales by Business Segment
29%
9%
30%
12% 20%
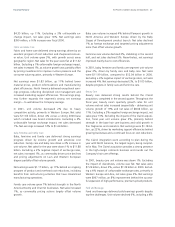
Health Care
Fabric and Home Care
Baby, Feminine
and Family Care
Beauty Care
Food and Beverage
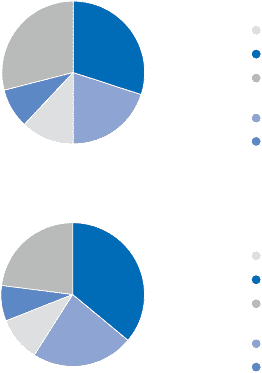
Health Care
Fabric and Home Care
Baby, Feminine
and Family Care
Beauty Care
Food and Beverage
2002 Net Earnings by Business Segment
Financial Review20 The Procter & Gamble Company and Subsidiaries
commitments or related party transactions that are
considered material. The Company is not aware of factors
that are reasonably likely to adversely affect liquidity trends,
other than the factors discussed in the Forward-Looking
Statements.
Purchase Commitments
The Company has purchase commitments for materials,
supplies, services and fixed assets as part of the normal
course of business. In the aggregate, such commitments are
not at prices in excess of current market rates. Due to the
proprietary nature of many of the Company’s materials and
processes, certain supply contracts contain penalty provisions
for early termination. The Company does not expect changes
in such provisions to materially affect results of operations or
its financial condition. This conclusion is made based upon
reasonably likely outcomes assumed by reference to historical
experience and current business plans.
As discussed previously, the Company’s primary source of
liquidity is cash generated from operations. Additionally, the
Company is able to support its short-term liquidity, if
necessary, through agreements with a diverse group of
creditworthy financial institutions. The Company has never
drawn on these facilities and does not intend to do so in the
foreseeable future. However, should the facilities be needed,
when combined with cash on hand, the Company believes
they would provide the Company with sufficient credit fund-
ing to cover any short-term financing requirements.
Segment Results
The following pages provide perspective on the Company’s
business segments. Product-based segment results exclude
items that are not included in measuring business perform-
ance for management reporting purposes, most notably
certain financing, investing, employee benefit and restructur-
ing costs.
Sales in companies over which the Company exerts signifi-
cant influence, but does not control the financial and
operating decisions, are reported for segment purposes in
a manner similar to consolidated subsidiaries. Taxes are
reflected in the business segments at estimated local statuto-
ry tax rates. The effects of these conventions are eliminated
in the corporate segment to adjust management reporting
conventions to accounting principles generally accepted in
the United States of America.
Health Care
Health care delivered exceptional results, as strength in the
oral care and pharmaceutical businesses drove a 15%
increase in unit volume and a 14% increase in net sales. Net
sales were $4.98 billion in 2002. Excluding a 1% negative
impact of foreign exchange, net sales grew 15%. Health
care’s volume growth from high-margin products funded in-
creased marketing investments and yielded a net earnings
increase of 34% to $521 million.
Oral care led the volume growth, up significantly versus
2001. The global Crest brand continued to grow behind
strength across the portfolio, including Crest SpinBrush,
Crest Whitestrips and the base dentifrice business. In 2002,
Crest joined the ranks of the Company’s billion dollar brands.
Pet health and nutrition volume increased 10% behind
continued growth in the United States. Global growth was
driven by new product innovation and expansion into new
geographies and channels outside the United States in the
second half of the year.
Pharmaceuticals continued to deliver strong results with
worldwide volume up 29%, behind the strength of Actonel,
the Company’s post-menopausal osteoporosis drug.
In 2001, health care unit volume increased 15%, driven by
the excellent performance of the pet health and nutrition,
pharmaceuticals and oral care businesses. Net sales were
36%
8%
23%
10%
23%