Proctor and Gamble 2002 Annual Report Download - page 20
Download and view the complete annual report
Please find page 20 of the 2002 Proctor and Gamble annual report below. You can navigate through the pages in the report by either clicking on the pages listed below, or by using the keyword search tool below to find specific information within the annual report.-
 1
1 -
2
-
3
-
4
-
5
-
6
-
7
-
8
-
9
-
 10
10 -
 11
11 -
 12
12 -
 13
13 -
 14
14 -
 15
15 -
 16
16 -
 17
17 -
 18
18 -
 19
19 -
 20
20 -
 21
21 -
 22
22 -
 23
23 -
 24
24 -
 25
25 -
 26
26 -
 27
27 -
 28
28 -
 29
29 -
 30
30 -
31
-
32
-
33
-
34
-
35
-
36
-
37
-
38
-
39
-
40
-
41
-
42
-
43
-
44
-
45
-
46
-
47
-
48
-
49
-
50
-
51
-
52
 |
 |
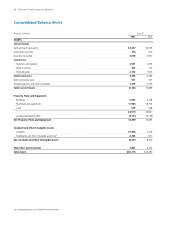
Financial Review18 The Procter & Gamble Company and Subsidiaries
Additionally, the Company is beginning to see gross margin
improvement from the shift to higher-margin businesses,
such as health care and beauty care. Excluding restructuring
charges, gross margin in 2001 reflects fairly stable cost of
products sold, despite raw material price increases – high-
lighting the benefits of cost control efforts.
Marketing, research, administrative and other expense
(MRA&O) was $12.57 billion in 2002 versus $12.41 billion in
2001 and $12.48 billion in 2000. These include restructuring
costs of $519 million in 2002, $583 million in 2001 and $318
million in 2000. Excluding restructuring charges and
amortization of goodwill and indefinite-lived intangibles,
MRA&O was $12.05 billion in the current year versus $11.59
billion in 2001 and $11.94 billion in 2000. As a percent of
core net sales, MRA&O was 30.0% in 2002, 29.4% in 2001
and 29.9% in 2000. The Company achieved good progress
on restructuring savings that have reduced base selling,
research and administrative costs. The increase in the current
year was due primarily to Clairol integration costs and
increases in other operating charges. Additionally, marketing
support efficiencies realized in the prior year continued in the
current year – although marketing costs did not decline as
dramatically due to the significant progress made in the
prior year.
Operating & Net Earnings Margins
Operating margin was 16.6% compared to 12.1% in 2001
and 14.9% in 2000. Excluding restructuring charges and
amortization of goodwill and indefinite-lived intangibles, core
operating margin increased 170 basis points to 19.0%, from
17.3% in 2001. Core operating margin was 17.5% in 2000.
Net earnings margin was 10.8% versus 7.4% in 2001 and
8.9% in 2000. Excluding restructuring charges and
amortization of goodwill and indefinite-lived intangibles,
core net earnings margin was 12.6%, up from 11.7% in
2001 and 11.1% in 2000. The margin increase in 2002
reflects excellent operating earnings progress and the
benefits of lower interest expense. In 2001, the core net
margin increase reflected the gains from minor brand
divestitures and lower taxes, partially offset by increased
product costs and unfavorable exchange impacts.
Non-Operating Items
Interest expense was $603 million in 2002, compared to
$794 million in 2001 and $722 million in 2000. The decline
in interest expense was driven by lower interest rates
partially offset by an increase in debt. The increase in 2001
reflected higher debt levels, primarily due to share repurch-
asing and acquisitions.
Other non-operating income, net, which consists primarily of
interest and investment income and divestiture gains,
contributed $308 million in 2002, compared to $674 million
in 2001 and $304 million in 2000. This decline is driven by
significantly lower income from divestitures and asset sales in
2002 versus 2001 as the Company’s activity to divest
non-core brands declined. Going forward, divestitures are
expected to remain at these lower levels.
The Company’s effective tax rate for the current year was
31.8%, compared to 36.7% in 2001 and 36.0% in 2000.
Excluding restructuring costs, amortization of goodwill and
indefinite-lived intangibles and related tax effects, the core
effective tax rate was flat versus 2001 at 31.1% compared to
32.5% in 2000.
Financial Condition
The Company’s financial condition remains solid – particularly
regarding cash flow generation. One of the Company’s focus
areas is to improve its cash efficiency as a key element of
achieving superior shareholder return.
Cash
Operating cash flow provides the primary source of funds to
finance operating needs, capital expenditures and share-
holder dividends. This is supplemented by additional borrow-
ings to provide funds to finance the share repurchase
program and acquisitions. The overall cash position of the
Company reflects a global strategy to optimize cash man-
agement while considering off-shore funding needs, liquidity
management objectives and other economic considerations.
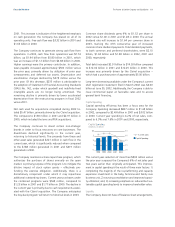
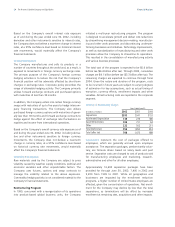
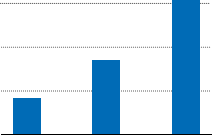
Free cash flow, defined as operating cash flow less capital
expenditures, for 2002 was $6.06 billion, up over 80% from
2000 2001 2002
$6
4
2
0
Free Cash Flow
(in billions of dollars)