Proctor and Gamble 2002 Annual Report Download - page 2
Download and view the complete annual report
Please find page 2 of the 2002 Proctor and Gamble annual report below. You can navigate through the pages in the report by either clicking on the pages listed below, or by using the keyword search tool below to find specific information within the annual report.-
 1
1 -
 2
2 -
 3
3 -
 4
4 -
 5
5 -
 6
6 -
 7
7 -
 8
8 -
 9
9 -
 10
10 -
 11
11 -
 12
12 -
 13
13 -
14
-
15
-
16
-
17
-
18
-
19
-
20
-
21
-
22
-
23
-
24
-
25
-
26
-
27
-
28
-
29
-
30
-
31
-
32
-
33
-
34
-
35
-
36
-
37
-
38
-
39
-
40
-
41
-
42
-
43
-
44
-
45
-
46
-
47
-
48
-
49
-
50
-
51
-
52
 |
 |

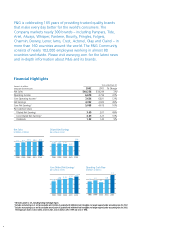
Operating Cash Flow
(in billions of dollars)
Years ended June 30
% Change
3%*
41%
12%
49%
10%
49%
10%
9%
2001
$39,244
4,736
6,821
2,922
4,615
2.07
3.27
1.40
2002
$40,238
6,678
7,636
4,352
5,058
3.09
3.59
1.52
Net Sales
Operating Income
Core Operating Income
Net Earnings
Core Net Earnings
Per Common Share
Diluted Net Earnings
Core Diluted Net Earnings
Dividends
Amounts in millions
except per share amounts
†
†
†
2.56 2.59 2.47 2.07
3.09
20021998 1999 2000 2001
Diluted Net Earnings
(per common share)
20021998 1999 2000 2001
3.59
Core Diluted Net Earnings1
(per common share)
2.68 2.98 3.10 3.27
20021998 1999 2000 2001
37.2 38.1 40.0 40.2
39.2
Net Sales
(in billions of dollars)
2000 2001 2002
4.7
7.7
5.8
1998 1999
4.9 5.5
P&G is celebrating 165 years of providing trusted quality brands
that make every day better for the world’s consumers. The
Company markets nearly 300 brands – including Pampers, Tide,
Ariel, Always, Whisper, Pantene, Bounty, Pringles, Folgers,
Charmin, Downy, Lenor, Iams, Crest, Actonel, Olay and Clairol – in
more than 160 countries around the world. The P&G Community
consists of nearly 102,000 employees working in almost 80
countries worldwide. Please visit www.pg.com for the latest news
and in-depth information about P&G and its brands.
*
Net Sales growth is 4%, excluding foreign exchange impact.
†
Excludes restructuring costs and also excludes amortization of goodwill and indefinite-lived intangibles no longer required under accounting rules for 2002.
1
Excludes restructuring costs and also excludes amortization of goodwill and indefinite-lived intangibles no longer required under the accounting rules for 2002.
The impact per share is $.50 in 2002, $1.20 in 2001, $.63 in 2000, $.39 in 1999, and $.12 in 1998.
Financial Highlights
Operating Cash Flow
(in billions of dollars)
2.56 2.59 2.47 2.07
3.09
20021998 1999 2000 2001
Diluted Net Earnings
(per common share)
20021998 1999 2000 2001
3.59
Core Diluted Net Earnings1
(per common share)
2.68 2.98 3.10 3.27
20021998 1999 2000 2001
37.2 38.1 40.0 40.2
39.2
Net Sales
(in billions of dollars)
2000 2001 2002
4.7
7.7
5.8
1998 1999
4.9 5.5
Years ended June 30
% Change
3%*
41%
12%
49%
10%
49%
10%
9%
2001
$39,244
4,736
6,821
2,922
4,615
2.07
3.27
1.40
2002
$40,238
6,678
7,636
4,352
5,058
3.09
3.59
1.52
Net Sales
Operating Income
Core Operating Income
Net Earnings
Core Net Earnings
Per Common Share
Diluted Net Earnings
Core Diluted Net Earnings
Dividends
Amounts in millions
except per share amounts
†
†
1
*
Net Sales growth is 4%, excluding foreign exchange impact.
†
Excludes restructuring costs and also excludes amortization of goodwill and indefinite-lived intangibles no longer required under accounting rules for 2002.
1
Excludes restructuring costs and also excludes amortization of goodwill and indefinite-lived intangibles no longer required under accounting rules for 2002.
The impact per share is $.50 in 2002, $1.20 in 2001, $.63 in 2000, $.39 in 1999 and $.12 in 1998.