Panera Bread 2012 Annual Report Download - page 77
Download and view the complete annual report
Please find page 77 of the 2012 Panera Bread annual report below. You can navigate through the pages in the report by either clicking on the pages listed below, or by using the keyword search tool below to find specific information within the annual report.-
 1
1 -
2
-
3
-
4
-
5
-
6
-
7
-
8
-
9
-
10
-
11
-
12
-
13
-
14
-
15
-
16
-
17
-
18
-
19
-
20
-
21
-
22
-
23
-
24
-
25
-
26
-
27
-
28
-
29
-
30
-
31
-
32
-
33
-
34
-
35
-
36
-
37
-
38
-
39
-
40
-
41
-
42
-
43
-
44
-
45
-
46
-
47
-
48
-
49
-
50
-
51
-
52
-
53
-
54
-
55
-
56
-
57
-
58
-
59
-
60
-
61
-
62
-
63
-
64
-
65
-
66
-
 67
67 -
 68
68 -
 69
69 -
 70
70 -
 71
71 -
 72
72 -
 73
73 -
 74
74 -
 75
75 -
 76
76 -
 77
77 -
 78
78 -
 79
79 -
 80
80 -
 81
81 -
 82
82 -
 83
83 -
 84
84 -
 85
85 -
 86
86 -
 87
87 -
88
 |
 |

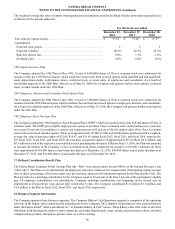
PANERA BREAD COMPANY
NOTES TO THE CONSOLIDATED FINANCIAL STATEMENTS (continued)
69
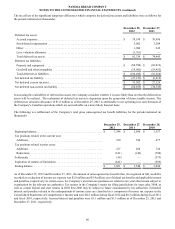
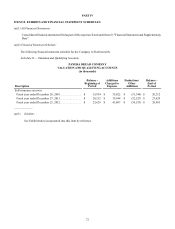
20. Supplemental Cash Flow Information
The following table sets forth supplemental cash flow information for the periods indicated (in thousands):
For the fiscal year ended
December 25,
2012 December 27,
2011 December 28,
2010
Cash paid during the year for (in thousands):
Interest. . . . . . . . . . . . . . . . . . . . . . . . . . . . . . . . . . . . . . . . . . . . . . . . . . . . . $ 370 $ 390 $ 379
Income taxes . . . . . . . . . . . . . . . . . . . . . . . . . . . . . . . . . . . . . . . . . . . . . . . . 90,054 80,572 68,263
Non-cash investing and financing activities (in thousands):
Change in accrued property and equipment purchases . . . . . . . . . . . . . . . . $ 6,019 $ 6,060 $ 6,547
Accrued purchase price of noncontrolling interest . . . . . . . . . . . . . . . . . . . — — 764
Accrued purchase price of New Jersey acquisition. . . . . . . . . . . . . . . . . . . — — 2,755
Accrued purchase price of Milwaukee acquisition . . . . . . . . . . . . . . . . . . . — 2,055 —
Accrued purchase price of Indiana acquisition . . . . . . . . . . . . . . . . . . . . . . — 510 —
Accrued purchase price of North Carolina acquisition . . . . . . . . . . . . . . . . 3,601 — —
Canadian note receivable. . . . . . . . . . . . . . . . . . . . . . . . . . . . . . . . . . . . . . . — — 3,333
Investment in municipal industrial revenue bonds . . . . . . . . . . . . . . . . . . . (186) 156 1,517
Asset retirement obligations . . . . . . . . . . . . . . . . . . . . . . . . . . . . . . . . . . . . 2,855 474 554
Capital lease obligations . . . . . . . . . . . . . . . . . . . . . . . . . . . . . . . . . . . . . . . 3,481 — —
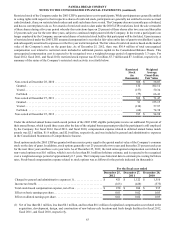
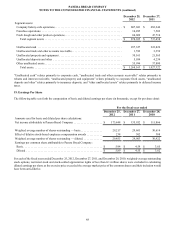
21. Selected Quarterly Financial Data (unaudited)
The following table presents selected unaudited quarterly financial data for the periods indicated (in thousands, except per share
data):
Fiscal 2012 - quarters ended (1)
March 27 June 26 September 25 December 25
Revenues . . . . . . . . . . . . . . . . . . . . . . . . . . . . . . . . . . . . . . . $ 498,579 $ 530,591 $ 529,338 $ 571,549
Operating profit . . . . . . . . . . . . . . . . . . . . . . . . . . . . . . . . . . 67,356 72,203 59,999 83,312
Net income. . . . . . . . . . . . . . . . . . . . . . . . . . . . . . . . . . . . . . 41,184 44,137 36,515 51,612
Earnings per common share:
Basic . . . . . . . . . . . . . . . . . . . . . . . . . . . . . . . . . . . . . . . . . $ 1.41 $ 1.51 $ 1.25 $ 1.77
Diluted. . . . . . . . . . . . . . . . . . . . . . . . . . . . . . . . . . . . . . . . $ 1.40 $ 1.50 $ 1.24 $ 1.75
Fiscal 2011 - quarters ended (1)
March 29 June 28 September 27 December 27
Revenues . . . . . . . . . . . . . . . . . . . . . . . . . . . . . . . . . . . . . . . $ 422,100 $ 451,080 $ 453,087 $ 495,765
Operating profit . . . . . . . . . . . . . . . . . . . . . . . . . . . . . . . . . . 52,974 57,132 47,607 62,546
Net income. . . . . . . . . . . . . . . . . . . . . . . . . . . . . . . . . . . . . . 32,774 35,710 28,848 38,620
Earnings per common share:
Basic . . . . . . . . . . . . . . . . . . . . . . . . . . . . . . . . . . . . . . . . . $ 1.10 $ 1.20 $ 0.98 $ 1.33
Diluted. . . . . . . . . . . . . . . . . . . . . . . . . . . . . . . . . . . . . . . . $ 1.09 $ 1.18 $ 0.97 $ 1.31
(1) Fiscal quarters may not sum to the fiscal year reported amounts due to rounding.
The fourth quarter of fiscal 2011 results includes the impact of a $5.0 million charge, or $0.11 per diluted share, related to a class
action lawsuit.