Panera Bread 2012 Annual Report Download - page 76
Download and view the complete annual report
Please find page 76 of the 2012 Panera Bread annual report below. You can navigate through the pages in the report by either clicking on the pages listed below, or by using the keyword search tool below to find specific information within the annual report.-
 1
1 -
2
-
3
-
4
-
5
-
6
-
7
-
8
-
9
-
10
-
11
-
12
-
13
-
14
-
15
-
16
-
17
-
18
-
19
-
20
-
21
-
22
-
23
-
24
-
25
-
26
-
27
-
28
-
29
-
30
-
31
-
32
-
33
-
34
-
35
-
36
-
37
-
38
-
39
-
40
-
41
-
42
-
43
-
44
-
45
-
46
-
47
-
48
-
49
-
50
-
51
-
52
-
53
-
54
-
55
-
56
-
57
-
58
-
59
-
60
-
61
-
62
-
63
-
64
-
65
-
 66
66 -
 67
67 -
 68
68 -
 69
69 -
 70
70 -
 71
71 -
 72
72 -
 73
73 -
 74
74 -
 75
75 -
 76
76 -
 77
77 -
 78
78 -
 79
79 -
 80
80 -
 81
81 -
 82
82 -
 83
83 -
 84
84 -
 85
85 -
 86
86 -
87
-
88
 |
 |

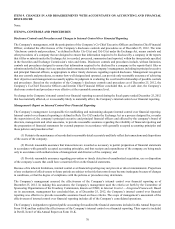
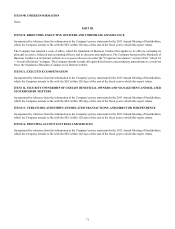
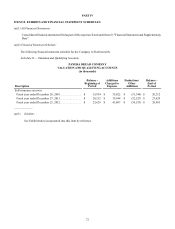
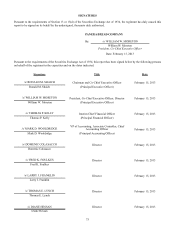
PANERA BREAD COMPANY
NOTES TO THE CONSOLIDATED FINANCIAL STATEMENTS (continued)
68
December 25,
2012 December 27,
2011
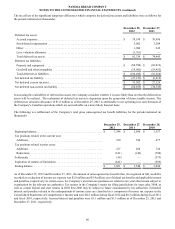
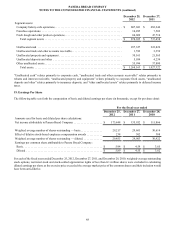
Segment assets:
Company bakery-cafe operations. . . . . . . . . . . . . . . . . . . . . . . . . . . . . . . . . . . . . . . . . . . . . . . $ 807,681 $ 682,246
Franchise operations. . . . . . . . . . . . . . . . . . . . . . . . . . . . . . . . . . . . . . . . . . . . . . . . . . . . . . . . . 10,285 7,502
Fresh dough and other product operations. . . . . . . . . . . . . . . . . . . . . . . . . . . . . . . . . . . . . . . . 60,069 47,710
Total segment assets . . . . . . . . . . . . . . . . . . . . . . . . . . . . . . . . . . . . . . . . . . . . . . . . . . . . . . $ 878,035 $ 737,458
Unallocated cash . . . . . . . . . . . . . . . . . . . . . . . . . . . . . . . . . . . . . . . . . . . . . . . . . . . . . . . . . . . 297,327 222,826
Unallocated trade and other accounts receivable. . . . . . . . . . . . . . . . . . . . . . . . . . . . . . . . . . . 1,592 3,359
Unallocated property and equipment . . . . . . . . . . . . . . . . . . . . . . . . . . . . . . . . . . . . . . . . . . . . 30,161 21,565
Unallocated deposits and other . . . . . . . . . . . . . . . . . . . . . . . . . . . . . . . . . . . . . . . . . . . . . . . . 5,054 4,234
Other unallocated assets. . . . . . . . . . . . . . . . . . . . . . . . . . . . . . . . . . . . . . . . . . . . . . . . . . . . . . 55,994 37,880
Total assets. . . . . . . . . . . . . . . . . . . . . . . . . . . . . . . . . . . . . . . . . . . . . . . . . . . . . . . . . . . . . . $ 1,268,163 $ 1,027,322
“Unallocated cash” relates primarily to corporate cash, “unallocated trade and other accounts receivable” relates primarily to
rebates and interest receivable, “unallocated property and equipment” relates primarily to corporate fixed assets, “unallocated
deposits and other” relates primarily to insurance deposits, and “other unallocated assets” relates primarily to deferred income
taxes.
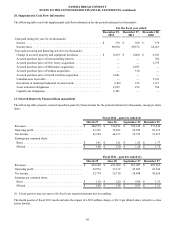
19. Earnings Per Share
The following table sets forth the computation of basic and diluted earnings per share (in thousands, except for per share data):
For the fiscal year ended
December 25,
2012 December 27,
2011 December 28,
2010
Amounts used for basic and diluted per share calculations:
Net income attributable to Panera Bread Company . . . . . . . . . . . . . . . . . . . . $ 173,448 $ 135,952 $ 111,866
Weighted average number of shares outstanding — basic . . . . . . . . . . . . . . . 29,217 29,601 30,614
Effect of dilutive stock-based employee compensation awards . . . . . . . . . . . 238 302 308
Weighted average number of shares outstanding — diluted. . . . . . . . . . . . . . 29,455 29,903 30,922
Earnings per common share attributable to Panera Bread Company:
Basic . . . . . . . . . . . . . . . . . . . . . . . . . . . . . . . . . . . . . . . . . . . . . . . . . . . . . . . $ 5.94 $ 4.59 $ 3.65
Diluted . . . . . . . . . . . . . . . . . . . . . . . . . . . . . . . . . . . . . . . . . . . . . . . . . . . . . $ 5.89 $ 4.55 $ 3.62
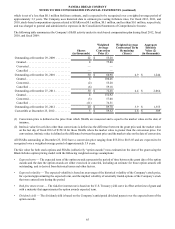
For each of the fiscal years ended December 25, 2012, December 27, 2011, and December 28, 2010, weighted-average outstanding
stock options, restricted stock and stock-settled appreciation rights of less than 0.1 million shares were excluded in calculating
diluted earnings per share as the exercise price exceeded the average market price of the common shares and their inclusion would
have been anti-dilutive.