Panera Bread 2012 Annual Report Download - page 36
Download and view the complete annual report
Please find page 36 of the 2012 Panera Bread annual report below. You can navigate through the pages in the report by either clicking on the pages listed below, or by using the keyword search tool below to find specific information within the annual report.-
 1
1 -
2
-
3
-
4
-
5
-
6
-
7
-
8
-
9
-
10
-
11
-
12
-
13
-
14
-
15
-
16
-
17
-
18
-
19
-
20
-
21
-
22
-
23
-
24
-
25
-
 26
26 -
 27
27 -
 28
28 -
 29
29 -
 30
30 -
 31
31 -
 32
32 -
 33
33 -
 34
34 -
 35
35 -
 36
36 -
 37
37 -
 38
38 -
 39
39 -
 40
40 -
 41
41 -
 42
42 -
 43
43 -
 44
44 -
 45
45 -
 46
46 -
47
-
48
-
49
-
50
-
51
-
52
-
53
-
54
-
55
-
56
-
57
-
58
-
59
-
60
-
61
-
62
-
63
-
64
-
65
-
66
-
67
-
68
-
69
-
70
-
71
-
72
-
73
-
74
-
75
-
76
-
77
-
78
-
79
-
80
-
81
-
82
-
83
-
84
-
85
-
86
-
87
-
88
 |
 |

28
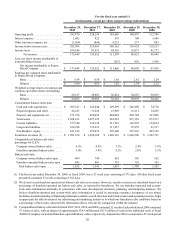
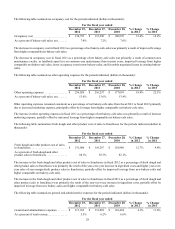
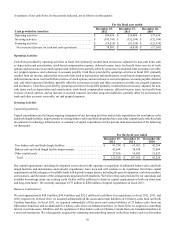
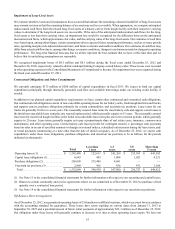
The following table summarizes occupancy cost for the periods indicated (dollars in thousands):
For the fiscal year ended
December 25,
2012 December 27,
2011 December 28,
2010 % Change
in 2012 % Change
in 2011
Occupancy cost . . . . . . . . . . . . . . . . . . . . . . . . $ 130,793 $ 115,290 $ 100,970 13.4% 14.2%
As a percent of bakery-cafe sales, net. . . . . . . 7.0% 7.2% 7.6%
The decrease in occupancy cost in fiscal 2012 as a percentage of net bakery-cafe sales was primarily a result of improved leverage
from higher comparable net bakery-cafe sales.
The decrease in occupancy cost in fiscal 2011 as a percentage of net bakery-cafe sales was primarily a result of common area
maintenance credits, as landlords spent less on common area maintenance than in prior years, improved leverage from higher
comparable net bakery-cafe sales, lower occupancy costs in new bakery-cafes, and favorably negotiated leases in existing bakery-
cafes.
The following table summarizes other operating expenses for the periods indicated (dollars in thousands):
For the fiscal year ended
December 25,
2012 December 27,
2011 December 28,
2010 % Change
in 2012 % Change
in 2011
Other operating expenses . . . . . . . . . . . . . . . . $ 256,029 $ 216,237 $ 177,059 18.4% 22.1%
As a percent of bakery-cafe sales, net. . . . . . . 13.6% 13.6% 13.4%
Other operating expenses remained consistent as a percentage of net bakery-cafe sales from fiscal 2011 to fiscal 2012 primarily
due to increased marketing expense, principally offset by leverage from higher comparable net bakery-cafe sales.
The increase in other operating expenses in fiscal 2011 as a percentage of net bakery-cafe sales was primarily a result of increase
marketing expense, partially offset by increased leverage from higher comparable net bakery-cafe sales.
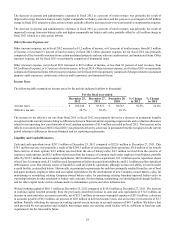
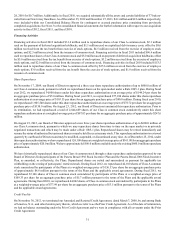
The following table summarizes fresh dough and other product cost of sales to franchisees for the periods indicated (dollars in
thousands):
For the fiscal year ended
December 25,
2012 December 27,
2011 December 28,
2010 % Change
in 2012 % Change
in 2011
Fresh dough and other product cost of sales
to franchisees. . . . . . . . . . . . . . . . . . . . . . . . . . $ 131,006 $ 116,267 $ 110,986 12.7% 4.8%
As a percent of fresh dough and other
product sales to franchisees. . . . . . . . . . . . . . . 88.1% 85.3% 82.1%
The increase in the fresh dough and other product cost of sales to franchisees in fiscal 2012 as a percentage of fresh dough and
other product sales to franchisees was primarily the result of the year-over-year increase in ingredient costs and higher year-over-
year sales of zero margin fresh produce sales to franchisees, partially offset by improved leverage from new bakery-cafes and
higher comparable net bakery-cafe sales.
The increase in the fresh dough and other product cost of sales to franchisees in fiscal 2011 as a percentage of fresh dough and
other product sales to franchisees was primarily the result of the year-over-year increase in ingredient costs, partially offset by
improved leverage from new bakery-cafes and higher comparable net bakery-cafe sales.
The following table summarizes general and administrative expenses for the periods indicated (dollars in thousands):
For the fiscal year ended
December 25,
2012 December 27,
2011 December 28,
2010 % Change
in 2012 % Change
in 2011
General and administrative expenses . . . . . . . $ 117,932 $ 113,083 $ 101,494 4.3% 11.4%
As a percent of total revenue. . . . . . . . . . . . . . 5.5% 6.2% 6.6%