Panera Bread 2012 Annual Report Download - page 33
Download and view the complete annual report
Please find page 33 of the 2012 Panera Bread annual report below. You can navigate through the pages in the report by either clicking on the pages listed below, or by using the keyword search tool below to find specific information within the annual report.-
 1
1 -
2
-
3
-
4
-
5
-
6
-
7
-
8
-
9
-
10
-
11
-
12
-
13
-
14
-
15
-
16
-
17
-
18
-
19
-
20
-
21
-
22
-
 23
23 -
 24
24 -
 25
25 -
 26
26 -
 27
27 -
 28
28 -
 29
29 -
 30
30 -
 31
31 -
 32
32 -
 33
33 -
 34
34 -
 35
35 -
 36
36 -
 37
37 -
 38
38 -
 39
39 -
 40
40 -
 41
41 -
 42
42 -
 43
43 -
44
-
45
-
46
-
47
-
48
-
49
-
50
-
51
-
52
-
53
-
54
-
55
-
56
-
57
-
58
-
59
-
60
-
61
-
62
-
63
-
64
-
65
-
66
-
67
-
68
-
69
-
70
-
71
-
72
-
73
-
74
-
75
-
76
-
77
-
78
-
79
-
80
-
81
-
82
-
83
-
84
-
85
-
86
-
87
-
88
 |
 |

25
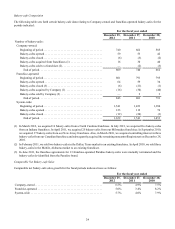
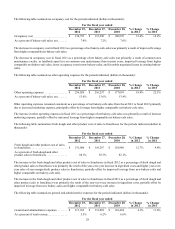
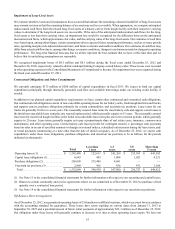
The following table summarizes the composition of comparable Company-owned net bakery-cafe sales growth for the periods
indicated:
For the fiscal year ended
December 25,
2012 December 27,
2011 December 28,
2010
Price . . . . . . . . . . . . . . . . . . . . . . . . . . . . . . . . . . . . . . . . . . . . . . . . . . . . . . . . 3.0% 2.9% 2.0%
Mix . . . . . . . . . . . . . . . . . . . . . . . . . . . . . . . . . . . . . . . . . . . . . . . . . . . . . . . . . 2.7% 0.2% 3.4%
Average check . . . . . . . . . . . . . . . . . . . . . . . . . . . . . . . . . . . . . . . . . . . . . . 5.7% 3.1% 5.4%
Transactions . . . . . . . . . . . . . . . . . . . . . . . . . . . . . . . . . . . . . . . . . . . . . . . . 0.8% 1.8% 2.1%
Company-owned comparable net bakery-cafe sales growth. . . . . . . . . 6.5% 4.9% 7.5%
Results of Operations
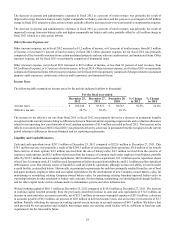
Revenues
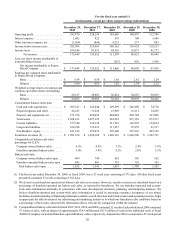
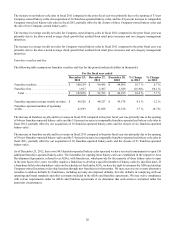
The following table summarizes revenues for the periods indicated (dollars in thousands):
For the fiscal year ended
December 25,
2012 December 27,
2011 December 28,
2010 % Change
in 2012 % Change
in 2011
Bakery-cafe sales, net . . . . . . . . . . . . . . . . . . . $ 1,879,280 $ 1,592,951 $ 1,321,162 18.0% 20.6%
Franchise royalties and fees . . . . . . . . . . . . . . 102,076 92,793 86,195 10.0% 7.7%
Fresh dough and other product sales to
franchisees. . . . . . . . . . . . . . . . . . . . . . . . . . . . 148,701 136,288 135,132 9.1% 0.9%
Total revenue . . . . . . . . . . . . . . . . . . . . . . . $ 2,130,057 $ 1,822,032 $ 1,542,489 16.9% 18.1%
System-wide average weekly net sales . . . . . . $ 46,676 $ 44,313 $ 42,852 5.3% 3.4%
The growth in total revenues in fiscal 2012 compared to the prior year was primarily due to the opening of 123 new bakery-cafes
system-wide in fiscal 2012 and to the 5.7 percent increase in system-wide comparable net bakery-cafe sales in fiscal 2012, partially
offset by the closure of 12 bakery-cafes system-wide in fiscal 2012.
The growth in total revenues in fiscal 2011 compared to the prior year was primarily due to the opening of 112 new bakery-cafes
system-wide in fiscal 2011 and to the 4.0 percent increase in system-wide comparable net bakery-cafe sales in fiscal 2011, partially
offset by the closure of 24 bakery-cafes system-wide in fiscal 2011.
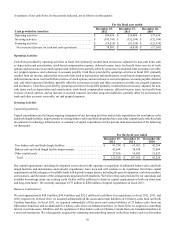
Bakery-cafe sales, net
The following table summarizes net bakery-cafe sales for the periods indicated (dollars in thousands):
For the fiscal year ended
December 25,
2012 December 27,
2011 December 28,
2010 % Change
in 2012 % Change
in 2011
Bakery-cafe sales, net . . . . . . . . . . . . . . . . . . . $ 1,879,280 $ 1,592,951 $ 1,321,162 18.0% 20.6%
As a percentage of total revenue. . . . . . . . . . . 88.2% 87.4% 85.7%
Company-owned average weekly net sales. . . $ 46,836 $ 44,071 $ 41,899 6.3% 5.2%
Company-owned number of operating weeks 40,125 36,140 31,532 11.0% 14.6%
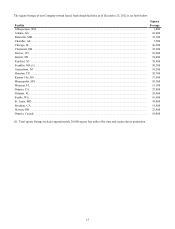
The increase in net bakery-cafe sales in fiscal 2012 compared to the prior fiscal year was primarily due to the opening of 59 new
Company-owned bakery-cafes, the acquisition of 16 franchise-operated bakery-cafes, and the 6.5 percent increase in comparable
Company-owned net bakery-cafe sales in fiscal 2012, partially offset by the closure of six Company-owned bakery-cafes.