Panera Bread 2012 Annual Report Download - page 28
Download and view the complete annual report
Please find page 28 of the 2012 Panera Bread annual report below. You can navigate through the pages in the report by either clicking on the pages listed below, or by using the keyword search tool below to find specific information within the annual report.-
 1
1 -
2
-
3
-
4
-
5
-
6
-
7
-
8
-
9
-
10
-
11
-
12
-
13
-
14
-
15
-
16
-
17
-
 18
18 -
 19
19 -
 20
20 -
 21
21 -
 22
22 -
 23
23 -
 24
24 -
 25
25 -
 26
26 -
 27
27 -
 28
28 -
 29
29 -
 30
30 -
 31
31 -
 32
32 -
 33
33 -
 34
34 -
 35
35 -
 36
36 -
 37
37 -
 38
38 -
39
-
40
-
41
-
42
-
43
-
44
-
45
-
46
-
47
-
48
-
49
-
50
-
51
-
52
-
53
-
54
-
55
-
56
-
57
-
58
-
59
-
60
-
61
-
62
-
63
-
64
-
65
-
66
-
67
-
68
-
69
-
70
-
71
-
72
-
73
-
74
-
75
-
76
-
77
-
78
-
79
-
80
-
81
-
82
-
83
-
84
-
85
-
86
-
87
-
88
 |
 |

20
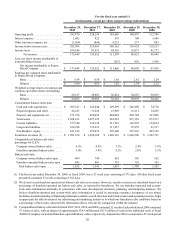
For the fiscal year ended (1)
(in thousands, except per share and percentage information)
December 25,
2012 December 27,
2011 December 28,
2010 December 29,
2009 December 30,
2008
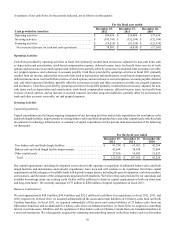
Operating profit . . . . . . . . . . . . . . . . . . . . 282,870 220,259 185,069 140,897 112,706
Interest expense . . . . . . . . . . . . . . . . . . . . 1,082 822 675 700 1,606
Other (income) expense, net . . . . . . . . . . (1,208) (466) 4,232 273 883
Income before income taxes . . . . . . . . . . 282,996 219,903 180,162 139,924 110,217
Income taxes . . . . . . . . . . . . . . . . . . . . . . 109,548 83,951 68,563 53,073 41,272
Net income. . . . . . . . . . . . . . . . . . 173,448 135,952 111,599 86,851 68,945
Less: net (loss) income attributable to
noncontrolling interest . . . . . . . . . . . . . . . — — (267) 801 1,509
Net income attributable to Panera
Bread Company . . . . . . . . . . . . . . . . $ 173,448 $ 135,952 $ 111,866 $ 86,050 $ 67,436
Earnings per common share attributable
to Panera Bread Company:
Basic . . . . . . . . . . . . . . . . . . . . . . . . . $ 5.94 $ 4.59 $ 3.65 2.81 $ 2.24
Diluted . . . . . . . . . . . . . . . . . . . . . . . $ 5.89 $ 4.55 $ 3.62 $ 2.78 $ 2.22
Weighted average shares of common and
common equivalent shares outstanding:
Basic . . . . . . . . . . . . . . . . . . . . . . . . . 29,217 29,601 30,614 30,667 30,059
Diluted . . . . . . . . . . . . . . . . . . . . . . . 29,455 29,903 30,922 30,979 30,422
Consolidated balance sheet data:
Cash and cash equivalents. . . . . . . . . . . $ 297,141 $ 222,640 $ 229,299 $ 246,400 $ 74,710
Prepaid expenses and other . . . . . . . . . . 42,223 31,228 23,905 16,211 14,265
Property and equipment, net . . . . . . . . . 571,754 492,022 444,094 403,784 417,006
Total assets. . . . . . . . . . . . . . . . . . . . . . . 1,268,163 1,027,322 924,581 837,165 673,917
Current liabilities. . . . . . . . . . . . . . . . . . 277,540 238,334 211,516 142,259 114,014
Long-term liabilities . . . . . . . . . . . . . . . 168,704 133,912 117,457 97,870 61,217
Stockholders’ equity . . . . . . . . . . . . . . . 821,919 655,076 595,608 597,036 495,162
Franchisee revenues (2) . . . . . . . . . . . . . . $ 1,981,674 $ 1,828,188 $ 1,802,116 $ 1,640,309 $ 1,542,791
Comparable net bakery-cafe sales
percentage for (2)(3):
Company-owned bakery-cafes . . . . . . . 6.5% 4.9% 7.5% 2.4% 3.8%
Franchise-operated bakery-cafes. . . . . . 5.0% 3.4% 8.2% 2.0% 3.5%
Bakery-cafe data:
Company-owned bakery-cafes open . . . 809 740 662 585 562
Franchise-operated bakery-cafes open . 843 801 791 795 763
Total bakery-cafes open . . . . . . . . . . . 1,652 1,541 1,453 1,380 1,325
(1) The fiscal year ended December 30, 2008, or fiscal 2008, was a 53 week year consisting of 371 days. All other fiscal years
presented contained 52 weeks consisting of 364 days.
(2) We do not record franchise-operated net bakery-cafe sales as revenues. However, royalty revenues are calculated based on a
percentage of franchise-operated net bakery-cafe sales, as reported by franchisees. We use franchise-operated and system-
wide sales information internally in connection with store development decisions, planning, and budgeting analyses. We
believe franchise-operated and system-wide sales information is useful in assessing consumer acceptance of our brand,
facilitates an understanding of financial performance and the overall direction and trends of sales and operating income, helps
us appreciate the effectiveness of our advertising and marketing initiatives to which our franchisees also contribute based on
a percentage of their sales, and provides information that is relevant for comparison within the industry.
(3) Comparable net bakery-cafe sales for fiscal 2012, 2011, 2010, and 2009 contained 52 weeks of sales while fiscal 2008 contained
53 weeks of sales, with an impact of approximately $14.4 million and $21.4 million of sales in the additional week of fiscal
2008 for Company-owned and franchise-operated bakery-cafes, respectively. Adjusted to reflect a comparative 52 week period