Panera Bread 2012 Annual Report Download - page 32
Download and view the complete annual report
Please find page 32 of the 2012 Panera Bread annual report below. You can navigate through the pages in the report by either clicking on the pages listed below, or by using the keyword search tool below to find specific information within the annual report.-
 1
1 -
2
-
3
-
4
-
5
-
6
-
7
-
8
-
9
-
10
-
11
-
12
-
13
-
14
-
15
-
16
-
17
-
18
-
19
-
20
-
21
-
 22
22 -
 23
23 -
 24
24 -
 25
25 -
 26
26 -
 27
27 -
 28
28 -
 29
29 -
 30
30 -
 31
31 -
 32
32 -
 33
33 -
 34
34 -
 35
35 -
 36
36 -
 37
37 -
 38
38 -
 39
39 -
 40
40 -
 41
41 -
 42
42 -
43
-
44
-
45
-
46
-
47
-
48
-
49
-
50
-
51
-
52
-
53
-
54
-
55
-
56
-
57
-
58
-
59
-
60
-
61
-
62
-
63
-
64
-
65
-
66
-
67
-
68
-
69
-
70
-
71
-
72
-
73
-
74
-
75
-
76
-
77
-
78
-
79
-
80
-
81
-
82
-
83
-
84
-
85
-
86
-
87
-
88
 |
 |

24
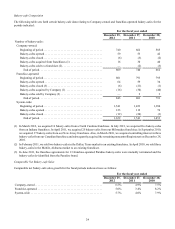
Bakery-cafe Composition
The following table sets forth certain bakery-cafe data relating to Company-owned and franchise-operated bakery-cafes for the
periods indicated:
For the fiscal year ended
December 25,
2012 December 27,
2011 December 28,
2010
Number of bakery-cafes:
Company-owned:
Beginning of period . . . . . . . . . . . . . . . . . . . . . . . . . . . . . . . . . . . . . . . . . 740 662 585
Bakery-cafes opened . . . . . . . . . . . . . . . . . . . . . . . . . . . . . . . . . . . . . . . . 59 53 42
Bakery-cafes closed . . . . . . . . . . . . . . . . . . . . . . . . . . . . . . . . . . . . . . . . . (6)(3)(2)
Bakery-cafes acquired from franchisees (1) . . . . . . . . . . . . . . . . . . . . . . 16 30 40
Bakery-cafes sold to a franchisee (2). . . . . . . . . . . . . . . . . . . . . . . . . . . . — (2)(3)
End of period. . . . . . . . . . . . . . . . . . . . . . . . . . . . . . . . . . . . . . . . . . . . 809 740 662
Franchise-operated:
Beginning of period . . . . . . . . . . . . . . . . . . . . . . . . . . . . . . . . . . . . . . . . . 801 791 795
Bakery-cafes opened . . . . . . . . . . . . . . . . . . . . . . . . . . . . . . . . . . . . . . . . 64 59 34
Bakery-cafes closed (3) . . . . . . . . . . . . . . . . . . . . . . . . . . . . . . . . . . . . . . (6)(21)(1)
Bakery-cafes acquired by Company (1) . . . . . . . . . . . . . . . . . . . . . . . . . (16)(30)(40)
Bakery-cafes sold by Company (2) . . . . . . . . . . . . . . . . . . . . . . . . . . . . . — 2 3
End of period. . . . . . . . . . . . . . . . . . . . . . . . . . . . . . . . . . . . . . . . . . . . 843 801 791
System-wide:
Beginning of period . . . . . . . . . . . . . . . . . . . . . . . . . . . . . . . . . . . . . . . . . 1,541 1,453 1,380
Bakery-cafes opened . . . . . . . . . . . . . . . . . . . . . . . . . . . . . . . . . . . . . . . . 123 112 76
Bakery-cafes closed . . . . . . . . . . . . . . . . . . . . . . . . . . . . . . . . . . . . . . . . . (12)(24)(3)
End of period. . . . . . . . . . . . . . . . . . . . . . . . . . . . . . . . . . . . . . . . . . . . 1,652 1,541 1,453
(1) In March 2012, we acquired 16 bakery-cafes from a North Carolina franchisee. In July 2011, we acquired five bakery-cafes
from an Indiana franchisee. In April 2011, we acquired 25 bakery-cafes from our Milwaukee franchisee. In September 2010,
we acquired 37 bakery-cafes from our New Jersey franchisee. Also, in March 2010, we acquired controlling interest in three
bakery-cafes from our Canadian franchisee and subsequently acquired the remaining noncontrolling interest on December 28,
2010.
(2) In February 2011, we sold two bakery-cafes in the Dallas, Texas market to an existing franchisee. In April 2010, we sold three
bakery-cafes in the Mobile, Alabama market to an existing franchisee.
(3) In June 2011, the franchise agreements for 13 franchise-operated Paradise bakery-cafes were mutually terminated and the
bakery-cafes de-identified from the Paradise brand.
Comparable Net Bakery-cafe Sales
Comparable net bakery-cafe sales growth for the fiscal periods indicated were as follows:
For the fiscal year ended
December 25,
2012 December 27,
2011 December 28,
2010
Company-owned. . . . . . . . . . . . . . . . . . . . . . . . . . . . . . . . . . . . . . . . . . . . . . . 6.5% 4.9% 7.5%
Franchise-operated . . . . . . . . . . . . . . . . . . . . . . . . . . . . . . . . . . . . . . . . . . . . . 5.0% 3.4% 8.2%
System-wide . . . . . . . . . . . . . . . . . . . . . . . . . . . . . . . . . . . . . . . . . . . . . . . . . . 5.7% 4.0% 7.9%