Panera Bread 2012 Annual Report Download - page 35
Download and view the complete annual report
Please find page 35 of the 2012 Panera Bread annual report below. You can navigate through the pages in the report by either clicking on the pages listed below, or by using the keyword search tool below to find specific information within the annual report.-
 1
1 -
2
-
3
-
4
-
5
-
6
-
7
-
8
-
9
-
10
-
11
-
12
-
13
-
14
-
15
-
16
-
17
-
18
-
19
-
20
-
21
-
22
-
23
-
24
-
 25
25 -
 26
26 -
 27
27 -
 28
28 -
 29
29 -
 30
30 -
 31
31 -
 32
32 -
 33
33 -
 34
34 -
 35
35 -
 36
36 -
 37
37 -
 38
38 -
 39
39 -
 40
40 -
 41
41 -
 42
42 -
 43
43 -
 44
44 -
 45
45 -
46
-
47
-
48
-
49
-
50
-
51
-
52
-
53
-
54
-
55
-
56
-
57
-
58
-
59
-
60
-
61
-
62
-
63
-
64
-
65
-
66
-
67
-
68
-
69
-
70
-
71
-
72
-
73
-
74
-
75
-
76
-
77
-
78
-
79
-
80
-
81
-
82
-
83
-
84
-
85
-
86
-
87
-
88
 |
 |

27
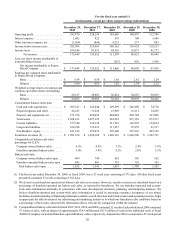
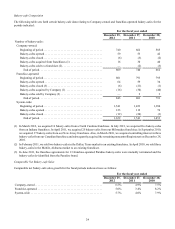
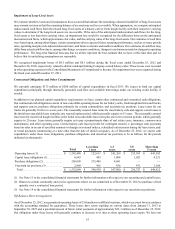
Fresh dough and other product sales to franchisees
The following table summarizes fresh dough and other product sales to franchisees for the periods indicated (dollars in thousands):
For the fiscal year ended
December 25,
2012 December 27,
2011 December 28,
2010 % Change
in 2012 % Change
in 2011
Fresh dough and other product sales to
franchisees. . . . . . . . . . . . . . . . . . . . . . . . . . . . $ 148,701 $ 136,288 $ 135,132 9.1% 0.9%
The increase in fresh dough and other product sales to franchisees in fiscal 2012 was primarily due to the 5.0 percent increase in
franchise-operated comparable net bakery-cafe sales, the opening of 64 franchise-operated cafes, and an increase in sales of fresh
produce to franchisees, partially offset by our purchase of 16 franchise-operated bakery-cafes and the closure of six franchise-
operated bakery-cafes.
The increase in fresh dough and other product sales to franchisees in fiscal 2011 was primarily due to the 3.4 percent increase in
franchise-operated comparable net bakery-cafe sales, the opening of 59 franchise-operated cafes, and new product offerings,
partially offset by our purchase of 30 franchise-operated bakery-cafes and the closure of 21 franchise-operated bakery-cafes.
Costs and Expenses
The cost of food and paper products includes the costs associated with the fresh dough and other product operations that sell fresh
dough and other products to Company-owned bakery-cafes, as well as the cost of food and paper products supplied by third-party
vendors and distributors. The costs associated with the fresh dough and other product operations that sell fresh dough and other
products to the franchise-operated bakery-cafes are excluded from the cost of food and paper products and are shown separately
as fresh dough and other product cost of sales to franchisees in the Consolidated Statements of Comprehensive Income.
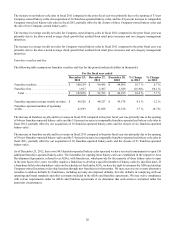
The following table summarizes cost of food and paper products for the periods indicated (dollars in thousands):
For the fiscal year ended
December 25,
2012 December 27,
2011 December 28,
2010 % Change
in 2012 % Change
in 2011
Cost of food and paper products . . . . . . . . . . . $ 552,580 $ 470,398 $ 374,816 17.5% 25.5%
As a percent of bakery-cafe sales, net. . . . . . . 29.4% 29.5% 28.4%
This decrease in the cost of food and paper products in fiscal 2012 as a percentage of net bakery-cafe sales was primarily due to
improved leverage of our fresh dough manufacturing costs due to additional bakery-cafe openings and improved leverage from
higher comparable net bakery-cafe sales. In fiscal 2012, there was an average of 74.8 bakery-cafes per fresh dough facility compared
to an average of 69.6 bakery-cafes in fiscal 2011.
This increase in the cost of food and paper products in fiscal 2011 as a percentage of net bakery-cafe sales was primarily due to
food cost inflation, partially offset by improved leverage of our fresh dough manufacturing costs due to additional bakery-cafe
openings and improved leverage from higher comparable net bakery-cafe sales. In fiscal 2011, there was an average of 69.6 bakery-
cafes per fresh dough facility compared to an average of 65.2 bakery-cafes in fiscal 2010.
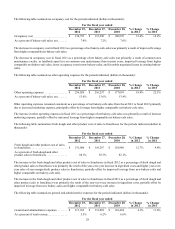
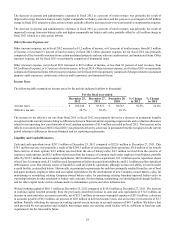
The following table summarizes labor expense for the periods indicated (dollars in thousands):
For the fiscal year ended
December 25,
2012 December 27,
2011 December 28,
2010 % Change
in 2012 % Change
in 2011
Labor expense . . . . . . . . . . . . . . . . . . . . . . . . . $ 559,446 $ 484,014 $ 419,140 15.6% 15.5%
As a percent of bakery-cafe sales, net. . . . . . . 29.8% 30.4% 31.7%
The decrease in labor expense in fiscal 2012 as a percentage of net bakery-cafe sales was primarily a result of improved leverage
from higher comparable net bakery-cafe sales and wage discipline.
The decrease in labor expense in fiscal 2011 as a percentage of net bakery-cafe sales was primarily a result of improved leverage
from higher comparable net bakery-cafe sales, lower benefit costs due to lower self-insurance medical claims, and wage discipline.