North Face 2001 Annual Report Download - page 70
Download and view the complete annual report
Please find page 70 of the 2001 North Face annual report below. You can navigate through the pages in the report by either clicking on the pages listed below, or by using the keyword search tool below to find specific information within the annual report.-
 1
1 -
2
-
3
-
4
-
5
-
6
-
7
-
8
-
9
-
10
-
11
-
12
-
13
-
14
-
15
-
16
-
17
-
18
-
19
-
20
-
21
-
22
-
23
-
24
-
25
-
26
-
27
-
28
-
29
-
30
-
31
-
32
-
33
-
34
-
35
-
36
-
37
-
38
-
39
-
40
-
41
-
42
-
43
-
44
-
45
-
46
-
47
-
48
-
49
-
50
-
51
-
52
-
53
-
54
-
55
-
56
-
57
-
58
-
59
-
 60
60 -
 61
61 -
 62
62 -
 63
63 -
 64
64 -
 65
65 -
 66
66 -
 67
67 -
 68
68 -
 69
69 -
 70
70 -
 71
71 -
 72
72 -
 73
73 -
 74
74 -
 75
75 -
 76
76
 |
 |
68
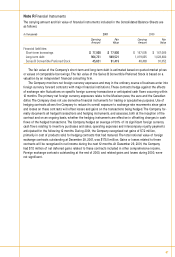
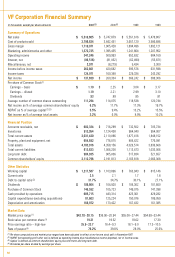
VF Corporation Financial Summary
In thousands, except per share amounts 2001(5) 2000(6) 1999 1998
Summary of Operations
Net sales $ 5,518,805 $ 5,747,879 $ 5,551,616 $ 5,478,807
Cost of products sold 3,798,834 3,842,451 3,657,120 3,586,686
Gross margin 1,719,971 1,905,428 1,894,496 1,892,121
Marketing, administrative and other 1,372,725 1,395,435 1,241,864 1,207,952
Operating income 347,246 509,993 652,632 684,169
Interest, net (86,516) (81,032) (62,490) (55,871)
Miscellaneous, net 2,071 (8,279) 5,434 3,300
Income before income taxes 262,801 420,682 595,576 631,598
Income taxes 124,971 160,348 229,334 243,292
Net income $ 137,830 $ 260,334 $ 366,242 $ 388,306
Per share of Common Stock(1)
Earnings – basic $ 1.19 $ 2.25 $ 3.04 $ 3.17
Earnings – diluted 1.19 2.21 2.99 3.10
Dividends .93 .89 .85 .81
Average number of common shares outstanding 111,294 114,075 118,538 120,744
Net income as % of average common shareholders’ equity 6.2% 11.7% 17.3% 19.7%
NOPAT as % of average capital(2) (3) 5.5% 9.4% 13.2% 15.5%
Net income as % of average total assets 3.2% 6.0% 8.9% 10.2%
Financial Position
Accounts receivable, net $ 602,334 $ 716,299 $ 732,502 $ 705,734
Inventories 913,054 1,124,438 964,040 954,007
Total current assets 2,031,420 2,110,096 1,877,416 1,848,152
Property, plant and equipment, net 654,692 776,015 804,422 776,091
Total assets 4,103,016 4,358,156 4,026,514 3,836,666
Total current liabilities 813,833 1,006,200 1,113,473 1,033,006
Long-term debt 904,035 905,036 517,834 521,657
Common shareholders’ equity 2,112,796 2,191,813 2,163,818 2,066,308
Other Statistics
Working capital $ 1,217,587 $ 1,103,896 $ 763,943 $ 815,146
Current ratio 2.5 2.1 1.7 1.8
Debt to capital ratio (3) 31.7% 34.7% 30.1% 27.1%
Dividends $ 106,864 $ 104,920 $ 104,302 $ 101,660
Purchase of Common Stock 146,592 105,723 149,075 147,398
Cash provided by operations 685,715 443,314 423,361 429,282
Capital expenditures (excluding acquisitions) 81,603 125,224 150,076 189,059
Depreciation and amortization 168,972 173,422 167,432 161,385
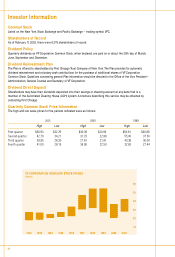
Market Data
Market price range (1) $42.70–28.15 $36.90–20.94 $55.00–27.44 $54.69–33.44
Book value per common share (1) 19.21 19.52 18.62 17.30
Price earnings ratio – high-low 35.9–23.7 16.4–9.3 18.1–9.0 17.3–10.5
Rate of payout (4) 78.2% 39.6% 28.0% 25.6%
(1) Per share computations and market price ranges have been adjusted to reflect a t wo-for-one stock split in November 1997.
(2) NOPAT (net operating profit after tax) is defined as operating income plus miscellaneous income (expense), net of income taxes.
(3) Capital is defined as common shareholders’ equity plus short-term and long-term debt.
(4) Dividends per share divided by earnings per share.