NetFlix 2007 Annual Report Download - page 71
Download and view the complete annual report
Please find page 71 of the 2007 NetFlix annual report below. You can navigate through the pages in the report by either clicking on the pages listed below, or by using the keyword search tool below to find specific information within the annual report.-
 1
1 -
2
-
3
-
4
-
5
-
6
-
7
-
8
-
9
-
10
-
11
-
12
-
13
-
14
-
15
-
16
-
17
-
18
-
19
-
20
-
21
-
22
-
23
-
24
-
25
-
26
-
27
-
28
-
29
-
30
-
31
-
32
-
33
-
34
-
35
-
36
-
37
-
38
-
39
-
40
-
41
-
42
-
43
-
44
-
45
-
46
-
47
-
48
-
49
-
50
-
51
-
52
-
53
-
54
-
55
-
56
-
57
-
58
-
59
-
60
-
 61
61 -
 62
62 -
 63
63 -
 64
64 -
 65
65 -
 66
66 -
 67
67 -
 68
68 -
 69
69 -
 70
70 -
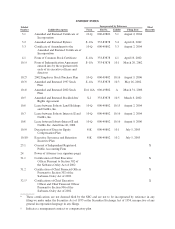
 71
71 -
 72
72 -
 73
73 -
 74
74 -
 75
75 -
 76
76 -
 77
77 -
 78
78 -
 79
79 -
 80
80 -
 81
81 -
82
-
83
 |
 |

NETFLIX, INC.
NOTES TO CONSOLIDATED FINANCIAL STATEMENTS—(Continued)
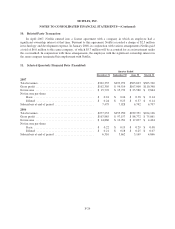
A summary of the activities related to the Company’s options is as follows:
Shares Available
for Grant
Options Outstanding Weighted-Average
Remaining
Contractual Term
(in Years)
Aggregate
Intrinsic Value
(in Thousands)
Number of
Shares
Weighted-Average
Exercise Price
Balances as of December 31, 2004 . . . . 4,251,012 5,815,752 7.91
Authorized . . . . . . . . . . . . . . . . . . . 2,000,000 — —
Granted . . . . . . . . . . . . . . . . . . . . . (1,741,319) 1,741,319 15.30
Exercised . . . . . . . . . . . . . . . . . . . . — (1,629,115) 6.22
Canceled . . . . . . . . . . . . . . . . . . . . 73,140 (73,140) 19.68
Balances as of December 31, 2005 . . . . 4,582,833 5,854,816 10.43
Authorized . . . . . . . . . . . . . . . . . . . 2,000,000 — —
Granted . . . . . . . . . . . . . . . . . . . . . (1,043,910) 1,043,910 25.70
Exercised . . . . . . . . . . . . . . . . . . . . — (1,379,012) 6.07
Canceled . . . . . . . . . . . . . . . . . . . . 66,261 (66,261) 28.56
Balances as of December 31, 2006 . . . . 5,605,184 5,453,453 14.23
Granted . . . . . . . . . . . . . . . . . . . . . (1,103,522) 1,103,522 21.72
Exercised . . . . . . . . . . . . . . . . . . . . — (828,824) 7.03
Canceled . . . . . . . . . . . . . . . . . . . . 108,513 (108,513) 29.46
Expired ..................... (615,309) — —
Balances as of December 31, 2007 . . . . 3,994,866 5,619,638 16.47 6.53 60,856
Vested and exercisable at December 31,
2007 . . . . . . . . . . . . . . . . . . . . . . . . . . 5,619,638 16.47 6.53 60,856
The aggregate intrinsic value in the table above represents the total pretax intrinsic value (the difference
between the Company’s closing stock price on the last trading day of 2007 and the exercise price, multiplied by
the number of in-the-money options) that would have been received by the option holders had all option holders
exercised their options on December 31, 2007. This amount changes based on the fair market value of the
Company’s common stock. Total intrinsic value of options exercised for the years ended December 31, 2007,
2006 and 2005 was $13.7 million, $29.2 million and $24.0 million, respectively.
Cash received from option exercises for the years ended December 31, 2007, 2006 and 2005 was $5.8
million, $8.4 million and $10.1 million, respectively.
The following table summarizes information on outstanding and exercisable options as of December 31,
2007:
Options Outstanding and Exercisable
Exercise Price Number of Options
Weighted-Average
Remaining
Contractual Life
(Years)
Weighted-Average
Exerices Price
$0.08 – $1.50 1,411,329 3.75 $ 1.50
$1.51 – $5.51 144,936 4.27 4.01
$5.52 – $11.48 406,235 6.70 10.69
$11.49 – $16.33 425,155 6.63 13.43
$16.34 – $21.45 1,006,254 8.18 19.16
$21.46 – $26.29 893,128 8.67 23.78
$26.30 – $29.60 1,006,781 7.25 27.74
$29.61 – $36.37 325,820 6.09 34.90
5,619,638 6.53 16.47
F-20