NetFlix 2007 Annual Report Download - page 41
Download and view the complete annual report
Please find page 41 of the 2007 NetFlix annual report below. You can navigate through the pages in the report by either clicking on the pages listed below, or by using the keyword search tool below to find specific information within the annual report.-
 1
1 -
2
-
3
-
4
-
5
-
6
-
7
-
8
-
9
-
10
-
11
-
12
-
13
-
14
-
15
-
16
-
17
-
18
-
19
-
20
-
21
-
22
-
23
-
24
-
25
-
26
-
27
-
28
-
29
-
30
-
 31
31 -
 32
32 -
 33
33 -
 34
34 -
 35
35 -
 36
36 -
 37
37 -
 38
38 -
 39
39 -
 40
40 -
 41
41 -
 42
42 -
 43
43 -
 44
44 -
 45
45 -
 46
46 -
 47
47 -
 48
48 -
 49
49 -
 50
50 -
 51
51 -
52
-
53
-
54
-
55
-
56
-
57
-
58
-
59
-
60
-
61
-
62
-
63
-
64
-
65
-
66
-
67
-
68
-
69
-
70
-
71
-
72
-
73
-
74
-
75
-
76
-
77
-
78
-
79
-
80
-
81
-
82
-
83
 |
 |

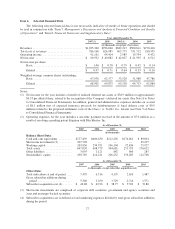
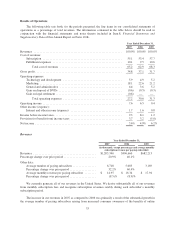
The increase in gross margin in 2006 as compared to 2005 was primarily due to a decrease in revenue
sharing cost per paid shipment, which includes a decline in the percentage of DVDs subject to revenue sharing
agreements mailed to paying subscribers, as well as an increase in revenue per paid shipment as a result of a
decline in overall usage and the continued popularity of our lower priced plans. The increase in postage rates by
2 cents effective January 8, 2006 negatively impacted gross margin, however, this impact was offset by a decline
in fulfillment costs as a result of increased operational efficiencies.
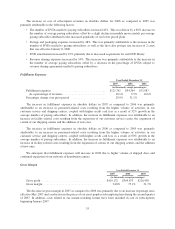
We anticipate that gross margin will decline in 2008, due to the impact of lower prices coupled with the
postage rate increase of one cent, which is effective May 2008.
Operating Expenses
Technology and Development
Year Ended December 31,
2007 2006 2005
(in thousands, except percentages)
Technology and development . . . . . . . . . . . . . . . . . . . . . . . . . . . . . . $71,395 $48,379 $35,388
As a percentage of revenues . . . . . . . . . . . . . . . . . . . . . . . . . . . . 5.9% 4.9% 5.2%
Percentage change over prior period . . . . . . . . . . . . . . . . . . . . . . . . . 47.6% 36.7%
The increase in technology and development expenses in absolute dollars for 2007 as compared to 2006 was
primarily the result of an increase in personnel-related costs due to growth in headcount and expenses related to
the development of solutions for the Internet-based delivery of content.
The increase in technology and development expenses in absolute dollars for 2006 as compared to 2005 was
primarily the result of an increase in personnel and facility-related costs, as well as expenses related to the
development of solutions for the Internet-based delivery of content.
We continuously research and test a variety of potential improvements to our internal hardware and
software systems in an effort to improve our productivity and enhance our subscribers’ experience. Additionally,
we continue to develop and enhance solutions for the Internet-based delivery of content to our subscribers. As a
result, we expect our technology and development expenses to increase in absolute dollars in 2008.
Marketing
Year Ended December 31,
2007 2006 2005
(in thousands, except percentages and
subscriber acquisition cost)
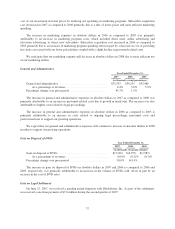
Marketing ........................................... $218,280 $225,524 $144,562
As a percentage of revenues . . . . . . . . . . . . . . . . . . . . . . . . . 18.1% 22.6% 21.2%
Percentage change over prior period . . . . . . . . . . . . . . . . . . . . . . (3.2)% 56.0%
Other data:
Gross subscriber additions . . . . . . . . . . . . . . . . . . . . . . . . . . . . . . 5,340 5,250 3,729
Percentage change over prior period . . . . . . . . . . . . . . . . . . . . . . 1.7% 40.8%
Subscriber acquisition cost . . . . . . . . . . . . . . . . . . . . . . . . . . . . . . $ 40.88 $ 42.96 $ 38.77
Percentage change over prior period . . . . . . . . . . . . . . . . . . . . . . (4.8)% 10.8%
The decrease in marketing expenses in absolute dollars in 2007 as compared to 2006 was primarily
attributable to a decrease in marketing program costs, principally in television advertising and direct mail. In the
second half of 2007, we lowered prices on our most popular subscription plans and decided to partially offset the
36