NetFlix 2007 Annual Report Download - page 56
Download and view the complete annual report
Please find page 56 of the 2007 NetFlix annual report below. You can navigate through the pages in the report by either clicking on the pages listed below, or by using the keyword search tool below to find specific information within the annual report.-
 1
1 -
2
-
3
-
4
-
5
-
6
-
7
-
8
-
9
-
10
-
11
-
12
-
13
-
14
-
15
-
16
-
17
-
18
-
19
-
20
-
21
-
22
-
23
-
24
-
25
-
26
-
27
-
28
-
29
-
30
-
31
-
32
-
33
-
34
-
35
-
36
-
37
-
38
-
39
-
40
-
41
-
42
-
43
-
44
-
45
-
 46
46 -
 47
47 -
 48
48 -
 49
49 -
 50
50 -
 51
51 -
 52
52 -
 53
53 -
 54
54 -
 55
55 -
 56
56 -
 57
57 -
 58
58 -
 59
59 -
 60
60 -
 61
61 -
 62
62 -
 63
63 -
 64
64 -
 65
65 -
 66
66 -
67
-
68
-
69
-
70
-
71
-
72
-
73
-
74
-
75
-
76
-
77
-
78
-
79
-
80
-
81
-
82
-
83
 |
 |

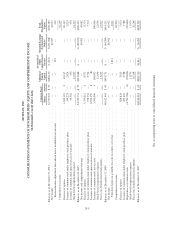
NETFLIX, INC.
CONSOLIDATED STATEMENTS OF STOCKHOLDERS’ EQUITY AND COMPREHENSIVE INCOME
(in thousands, except share data)
Common Stock Additional
Paid-in
Capital
Accumulated
Other
Comprehensive
Income
Retained Earnings
(Accumulated
Deficit)
Total
Stockholders’
EquityShares Amount
Balances as of December 31, 2004 . . . . . . . . . . . . . . . . . . . . . . . . . . . . . . . . . . . . . . . . . . . . 52,732,025 $ 53 $288,150 $ (222) $(131,698) $156,283
Netincome ............................................................ — — — — 42,027 42,027
Reclassification adjustment for realized losses included in net income . . . . . . . . . . . . — — — 222 — 222
Comprehensiveincome ................................................... 42,249
Exerciseofoptions ...................................................... 1,629,115 2 10,117 — — 10,119
Issuance of common stock under employee stock purchase plan . . . . . . . . . . . . . . . . . . . 349,229 — 2,824 — — 2,824
Issuance of common stock upon exercise of warrants . . . . . . . . . . . . . . . . . . . . . . . . . . . 45,362 — 450 — — 450
Stock-based compensation expense . . . . . . . . . . . . . . . . . . . . . . . . . . . . . . . . . . . . . . . . . — — 14,327 — — 14,327
Balances as of December 31, 2005 . . . . . . . . . . . . . . . . . . . . . . . . . . . . . . . . . . . . . . . . . . . . 54,755,731 $ 55 $315,868 $ — $ (89,671) $226,252
Net income and comprehensive income . . . . . . . . . . . . . . . . . . . . . . . . . . . . . . . . . . . . . . — — — — 49,082 49,082
Exerciseofoptions ...................................................... 1,379,012 2 8,372 — — 8,374
Issuance of common stock under employee stock purchase plan . . . . . . . . . . . . . . . . . . . 378,361 — 3,724 — — 3,724
Issuance of common stock upon exercise of warrants . . . . . . . . . . . . . . . . . . . . . . . . . . . 8,599,359 8 (8) — — —
Issuance of common stock, net of costs . . . . . . . . . . . . . . . . . . . . . . . . . . . . . . . . . . . . . . 3,500,000 4 100,862 — — 100,866
Stock-based compensation expense . . . . . . . . . . . . . . . . . . . . . . . . . . . . . . . . . . . . . . . . . — — 12,696 — — 12,696
Excess tax benefits from stock options . . . . . . . . . . . . . . . . . . . . . . . . . . . . . . . . . . . . . . . — — 13,217 — — 13,217
Balances as of December 31, 2006 . . . . . . . . . . . . . . . . . . . . . . . . . . . . . . . . . . . . . . . . . . . . 68,612,463 $ 69 $454,731 $ — $ (40,589) $414,211
Netincome ............................................................ — — — — 66,952 66,952
Unrealized gains on available-for-sale securities, net of tax . . . . . . . . . . . . . . . . . . . . . — — — 1,611 — 1,611
Comprehensiveincome ................................................... — — — — — 68,563
Exerciseofoptions ...................................................... 828,824 — 5,823 — — 5,823
Issuance of common stock under employee stock purchase plan . . . . . . . . . . . . . . . . . . . 205,416 — 3,788 — — 3,788
Repurchases of common stock . . . . . . . . . . . . . . . . . . . . . . . . . . . . . . . . . . . . . . . . . . . . . (4,733,788) (4) (99,856) (99,860)
Stock-based compensation expense . . . . . . . . . . . . . . . . . . . . . . . . . . . . . . . . . . . . . . . . . — — 11,976 — — 11,976
Excess tax benefits from stock options . . . . . . . . . . . . . . . . . . . . . . . . . . . . . . . . . . . . . . . — — 26,248 — — 26,248
Balances as of December 31, 2007 . . . . . . . . . . . . . . . . . . . . . . . . . . . . . . . . . . . . . . . . . . . . 64,912,915 $ 65 $402,710 $1,611 $ 26,363 $430,749
See accompanying notes to consolidated financial statements.
F-5