NetFlix 2007 Annual Report Download - page 39
Download and view the complete annual report
Please find page 39 of the 2007 NetFlix annual report below. You can navigate through the pages in the report by either clicking on the pages listed below, or by using the keyword search tool below to find specific information within the annual report.-
 1
1 -
2
-
3
-
4
-
5
-
6
-
7
-
8
-
9
-
10
-
11
-
12
-
13
-
14
-
15
-
16
-
17
-
18
-
19
-
20
-
21
-
22
-
23
-
24
-
25
-
26
-
27
-
28
-
 29
29 -
 30
30 -
 31
31 -
 32
32 -
 33
33 -
 34
34 -
 35
35 -
 36
36 -
 37
37 -
 38
38 -
 39
39 -
 40
40 -
 41
41 -
 42
42 -
 43
43 -
 44
44 -
 45
45 -
 46
46 -
 47
47 -
 48
48 -
 49
49 -
50
-
51
-
52
-
53
-
54
-
55
-
56
-
57
-
58
-
59
-
60
-
61
-
62
-
63
-
64
-
65
-
66
-
67
-
68
-
69
-
70
-
71
-
72
-
73
-
74
-
75
-
76
-
77
-
78
-
79
-
80
-
81
-
82
-
83
 |
 |

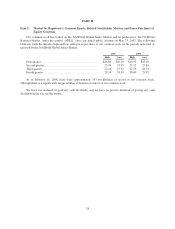
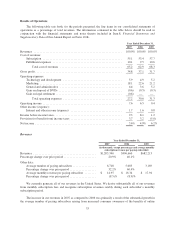
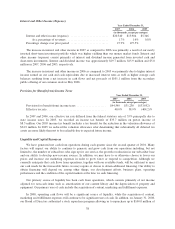
DVD rentals. This increase was offset in part by a decline in average monthly revenue per paying subscriber,
resulting from the continued growth in our lower cost subscription plans, as well as a price reduction for our most
popular subscription plans during the second quarter of 2007. We expect the average revenue per paying
subscriber to continue to decline until the mix of new subscribers and existing subscribers is approximately
equivalent by subscription plan price point.
The increase in our revenues in 2006 as compared to 2005 was primarily a result of the substantial growth in
the average number of paying subscribers offset in part by a decline in average monthly subscription revenue per
paying subscriber. We believe the increase in the number of paying subscribers was driven primarily by
increased consumer awareness of the benefits of online DVD rentals and continuing improvements in our
service. The decline in the average monthly revenue per paying subscriber was a result of the continued
popularity of our lower cost subscription plans.
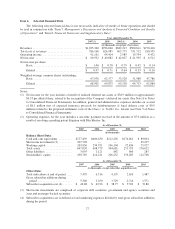
Churn was 4.3% as of December 31, 2007 and remained relatively flat as compared to 2006 and 2005.
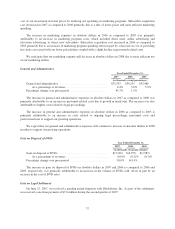
The following table presents our ending subscriber information:
As of December 31,
2007 2006 2005
(in thousands, except percentages)
Freesubscribers ......................................... 153 162 153
As a percentage of total subscribers . . . . . . . . . . . . . . . . . . . . . . . . 2.0% 2.6% 3.7%
Paidsubscribers ......................................... 7,326 6,154 4,026
As a percentage of total subscribers . . . . . . . . . . . . . . . . . . . . . . . . 98.0% 97.4% 96.3%
Totalsubscribers..................................... 7,479 6,316 4,179
Percentage change over prior period . . . . . . . . . . . . . . . . . . . . . . . . . 18.4% 51.1%
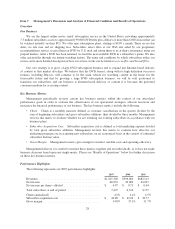
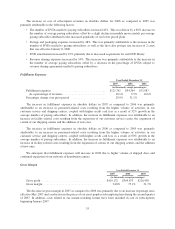
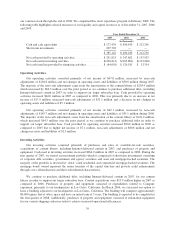
Cost of Revenues
Subscription
Year Ended December 31,
2007 2006 2005
(in thousands, except percentages)
Subscription ......................................... $664,407 $532,621 $393,788
As a percentage of revenues . . . . . . . . . . . . . . . . . . . . . . . . . . . 55.1% 53.4% 57.7%
Percentage change over prior period . . . . . . . . . . . . . . . . . . . . . . 24.7% 35.3%
The increase in cost of subscription revenues in absolute dollars for 2007 as compared to 2006 was
primarily attributable to the following factors:
• The number of DVDs mailed to paying subscribers increased 20%. This was driven by a 32% increase in
the number of average paying subscribers, partially offset by a decline in monthly movie rentals per
average paying subscriber attributed to the continued growth of our lower priced plans.
• Postage and packaging expenses increased by 24%. This was primarily attributable to the increase in the
number of DVDs mailed to paying subscribers, as well as an increase in the rate of first class postage of 2
cents in May 2007.
• Content amortization increased by 39% primarily due to increased acquisitions of our content library,
while revenue sharing expenses remained flat. In addition, costs related to our instant-watching feature
have been included in cost of subscription revenues since its introduction in January 2007.
34