NetFlix 2007 Annual Report Download - page 30
Download and view the complete annual report
Please find page 30 of the 2007 NetFlix annual report below. You can navigate through the pages in the report by either clicking on the pages listed below, or by using the keyword search tool below to find specific information within the annual report.-
 1
1 -
2
-
3
-
4
-
5
-
6
-
7
-
8
-
9
-
10
-
11
-
12
-
13
-
14
-
15
-
16
-
17
-
18
-
19
-
 20
20 -
 21
21 -
 22
22 -
 23
23 -
 24
24 -
 25
25 -
 26
26 -
 27
27 -
 28
28 -
 29
29 -
 30
30 -
 31
31 -
 32
32 -
 33
33 -
 34
34 -
 35
35 -
 36
36 -
 37
37 -
 38
38 -
 39
39 -
 40
40 -
41
-
42
-
43
-
44
-
45
-
46
-
47
-
48
-
49
-
50
-
51
-
52
-
53
-
54
-
55
-
56
-
57
-
58
-
59
-
60
-
61
-
62
-
63
-
64
-
65
-
66
-
67
-
68
-
69
-
70
-
71
-
72
-
73
-
74
-
75
-
76
-
77
-
78
-
79
-
80
-
81
-
82
-
83
 |
 |
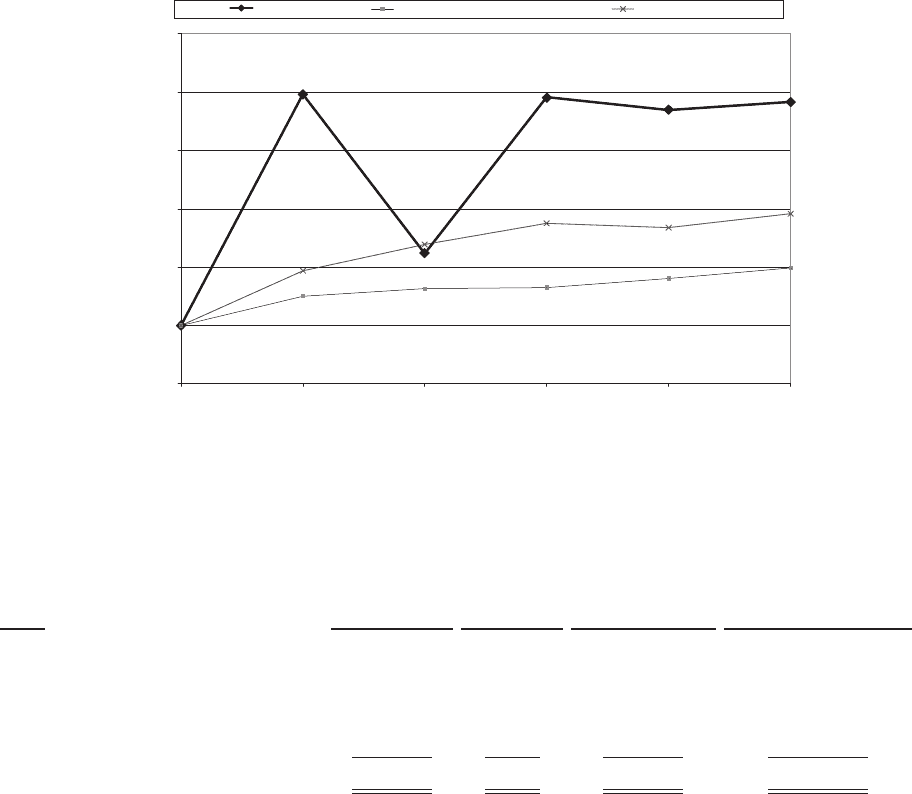
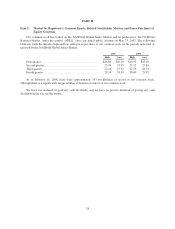
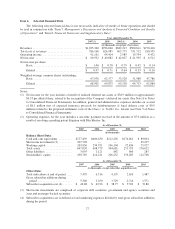
Stock Performance Graph
Notwithstanding any statement to the contrary in any of our previous or future filings with the Securities
and Exchange Commission, the following information relating to the price performance of our common stock
shall not be deemed “filed” with the Commission or “soliciting material” under the Securities Exchange Act of
1934 and shall not be incorporated by reference into any such filings.
The following graph compares, for the five year period ended December 31, 2007, the total cumulative
stockholder return on the Company’s common stock with the total cumulative return of the Nasdaq Composite
Index and the GSTI Internet Index. Measurement points are the last trading day of each of the Company’s fiscal
years ended December 31, 2002, December 31, 2003, December 31, 2004, December 31, 2005, December 31,
2006 and December 31, 2007. Total cumulative stockholder return assumes $100 invested at the beginning of the
period in the Company’s common stock, the stocks represented in the Nasdaq Composite Index and the stocks
represented in the GSTI Internet Index, respectively, and reinvestment of any dividends. The GSTI Internet Index
is a modified-capitalization weighted index of 14 stocks representing the Internet industry, including Internet
content and access providers, Internet software and services companies and e-commerce companies. Historical
stock price performance should not be relied upon as an indication of future stock price performance:
$0.00
$100.00
$200.00
$300.00
$400.00
$500.00
$600.00
Dec-02
Dec-03
Dec-04
Dec-05
Dec-06
Dec-07
Dollars
NFLX NASDAQ Composite Index GSTI Internet Index
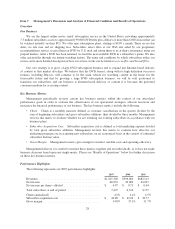
Issuer Purchases of Equity Securities
Stock repurchases during the three months ended December 31, 2007 were as follows:
Period
Total Number of
Shares Purchased
Average Price
Paid per Share
Total Number of
Shares Purchased as
Part of Publicly
Announced
Programs
Maximum Dollar Value
that May Yet Be Purchased
Under the Program
October 1, 2007—October 31, 2007 . . . 30,000 $26.27 30,000 $33,664,135
November 1, 2007—November 30,
2007 . . . . . . . . . . . . . . . . . . . . . . . . . . 1,259,639 26.61 1,259,639 —
December 1, 2007—December 31,
2007 .......................... — — — —
Total . . . . . . . . . . . . . . . . . . . . . . . . . . . . 1,289,639 $26.60 1,289,639 $ —
25