NetFlix 2007 Annual Report Download - page 43
Download and view the complete annual report
Please find page 43 of the 2007 NetFlix annual report below. You can navigate through the pages in the report by either clicking on the pages listed below, or by using the keyword search tool below to find specific information within the annual report.-
 1
1 -
2
-
3
-
4
-
5
-
6
-
7
-
8
-
9
-
10
-
11
-
12
-
13
-
14
-
15
-
16
-
17
-
18
-
19
-
20
-
21
-
22
-
23
-
24
-
25
-
26
-
27
-
28
-
29
-
30
-
31
-
32
-
 33
33 -
 34
34 -
 35
35 -
 36
36 -
 37
37 -
 38
38 -
 39
39 -
 40
40 -
 41
41 -
 42
42 -
 43
43 -
 44
44 -
 45
45 -
 46
46 -
 47
47 -
 48
48 -
 49
49 -
 50
50 -
 51
51 -
 52
52 -
 53
53 -
54
-
55
-
56
-
57
-
58
-
59
-
60
-
61
-
62
-
63
-
64
-
65
-
66
-
67
-
68
-
69
-
70
-
71
-
72
-
73
-
74
-
75
-
76
-
77
-
78
-
79
-
80
-
81
-
82
-
83
 |
 |

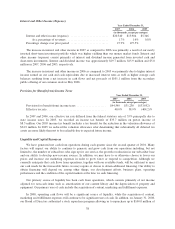
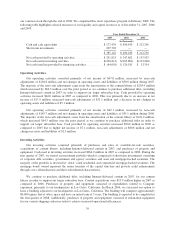
Interest and Other Income (Expense)
Year Ended December 31,
2007 2006 2005
(in thousands, except percentages)
Interest and other income (expense) . . . . . . . . . . . . . . . . . . . . . . . . . . $20,340 $15,904 $5,346
As a percentage of revenues . . . . . . . . . . . . . . . . . . . . . . . . . . . . . 1.7% 1.6% 0.8%
Percentage change over prior period . . . . . . . . . . . . . . . . . . . . . . . . . . 27.9% 197.5%
The increase in interest and other income in 2007 as compared to 2006 was primarily a result of our newly
invested short-term investment portfolio which was higher yielding than our money market funds. Interest and
other income (expense) consist primarily of interest and dividend income generated from invested cash and
short-term investments. Interest and dividend income was approximately $19.7 million, $15.9 million and $5.8
million in 2007, 2006 and 2005, respectively.
The increase in interest and other income in 2006 as compared to 2005 was primarily due to higher interest
income earned on our cash and cash equivalents due to increased interest rates as well as higher average cash
balances resulting from a net increase in cash flows and net proceeds of $101.1 million from the secondary
public offering of our common stock in May 2006.
Provision for (Benefit from) Income Taxes
Year Ended December 31,
2007 2006 2005
(in thousands, except percentages)
Provision for (benefit from) income taxes . . . . . . . . . . . . . . . . . . . . $44,549 $31,236 $(33,692)
Effectivetaxrate ........................................ 40.0% 38.9% (404.2)%
In 2007 and 2006, our effective tax rate differed from the federal statutory rate of 35% principally due to
state income taxes. In 2005, we recorded an income tax benefit of $33.7 million on pretax income of
$8.3 million. Our 2005 income tax benefit includes a tax benefit for the reduction in the valuation allowance of
$34.9 million. In 2005 we reduced the valuation allowance after determining that substantially all deferred tax
assets are more likely than not to be realizable due to expected future income.
Liquidity and Capital Resources
We have generated net cash from operations during each quarter since the second quarter of 2001. Many
factors will impact our ability to continue to generate and grow cash from our operations including, but not
limited to, the number of subscribers who sign up for our service, the growth or reduction in our subscriber base
and our ability to develop new revenue sources. In addition, we may have to or otherwise choose to lower our
prices and increase our marketing expenses in order to grow faster or respond to competition. Although we
currently anticipate that cash flows from operations, together with our available funds, will be sufficient to meet
our cash needs for the foreseeable future, we may require or choose to obtain additional financing. Our ability to
obtain financing will depend on, among other things, our development efforts, business plans, operating
performance and the condition of the capital markets at the time we seek financing.
Our primary source of liquidity has been cash from operations, which consists primarily of net income
adjusted for non-cash items such as amortization of our content library and the depreciation of property and
equipment. Our primary uses of cash include the acquisition of content, marketing and fulfillment expenses.
In 2008, operating cash flows will be a significant source of liquidity, while the acquisition of content,
marketing and fulfillment expenses will continue to be significant uses of cash. In addition, on January 31, 2008,
our Board of Directors authorized a stock repurchase program allowing us to repurchase up to $100.0 million of
38