National Grid 2007 Annual Report Download - page 85
Download and view the complete annual report
Please find page 85 of the 2007 National Grid annual report below. You can navigate through the pages in the report by either clicking on the pages listed below, or by using the keyword search tool below to find specific information within the annual report.-
 1
1 -
2
-
3
-
4
-
5
-
6
-
7
-
8
-
9
-
10
-
11
-
12
-
13
-
14
-
15
-
16
-
17
-
18
-
19
-
20
-
21
-
22
-
23
-
24
-
25
-
26
-
27
-
28
-
29
-
30
-
31
-
32
-
33
-
34
-
35
-
36
-
37
-
38
-
39
-
40
-
41
-
42
-
43
-
44
-
45
-
46
-
47
-
48
-
49
-
50
-
51
-
52
-
53
-
54
-
55
-
56
-
57
-
58
-
59
-
60
-
61
-
62
-
63
-
64
-
65
-
66
-
67
-
68
-
69
-
70
-
71
-
72
-
73
-
74
-
 75
75 -
 76
76 -
 77
77 -
 78
78 -
 79
79 -
 80
80 -
 81
81 -
 82
82 -
 83
83 -
 84
84 -
 85
85 -
 86
86
 |
 |

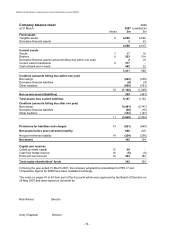
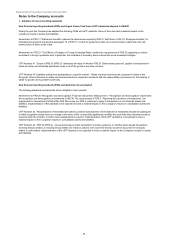
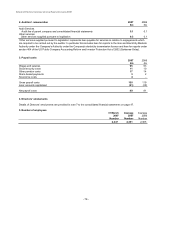
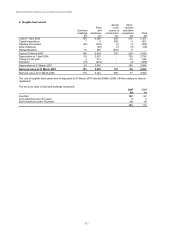
National Grid Electricity Transmission plc Annual Report and Accounts 2006/07
14. Net post-retirement liability (continued)
The amounts recognised in the balance sheet in respect of the Company's section of the Electricity Supply Pension Scheme
are as follows:
2007
2006
£m
£m
Fair value of plan assets
1,336
1,334
Present value of funded obligations
(1,787)
(1,688)
(451)
(354)
Present value of unfunded obligations
(12)
(13)
Deficit in the scheme
(463)
(367)
Related deferred tax asset
139
111
Net pension liability
(324)
(256)
2007
2006
£m
£m
Changes in the present value of the defined benefit obligation:
Opening defined benefit obligation
1,701
1,562
Current service cost
20
17
Interest cost
82
82
Actuarial losses
66
124
Loss on curtailments
3
2
Other augmentations
1
-
Employee contributions
6
6
Benefits paid
(81)
(78)
Net transfers in
1
(7)
Net increase in liabilities from disposals
-
(7)
Closing defined benefit obligation
1,799
1,701
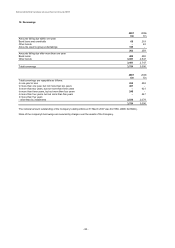
Changes in the fair value of plan assets:
Opening fair value of plan assets
1,334
1,161
Expected return on plan assets
89
73
Actuarial (losses)/gains
(30)
171
Employer contributions
18
15
Employee contributions
6
6
Benefits paid
(82)
(78)
Net transfers in
1
(7)
Net increase in assets from disposals
-
(7)
Closing fair value of plan assets
1,336
1,334
Expected contributions to defined benefit plans in the following year
12
12
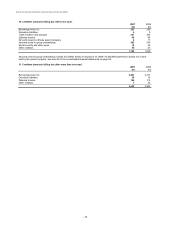
The major categories of plan assets as a percentage of total plan assets were as follows:
2007
2006
%
%
Equities
61.2%
60.9%
Corporate bonds
7.6%
7.5%
Gilts
24.2%
22.0%
Property
6.6%
8.4%
Cash
0.4%
1.2%
Total
100.0%
100.0%
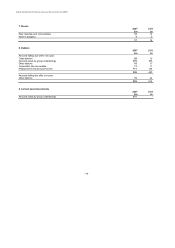
The amounts recognised in profit or loss are as follows:
2007
2006
£m
£m
Operating charge
Current service cost
21
17
Net loss on settlements or curtailments
3
2
Other augmentations
1
-
Total charge to operating profit
25
19
Other finance (income)/expense
Expected return on scheme assets
(84)
(76)
Interest on obligation
82
82
Impact on financial income
(2)
6
Net profit and loss charge before taxation
23
25
Actual return on plan assets
54
247
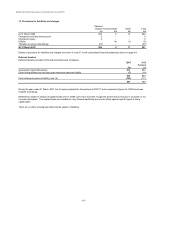
Amounts for the current and previous four periods are as follows:
2007
2006
2005
2004
2003
Defined benefit obligation
(1,799)
(1,701)
(1,562)
(1,537)
(1,392)
Plan assets
1,336
1,339
1,163
1,106
967
Surplus/(deficit)
(463)
(362)
(399)
(431)
(425)
Experience adjustment on plan liabilities
(3)
(11)
(17)
11
7
Experience adjustment on plan assets
(30)
171
38
127
(317)
- 83 -