National Grid 2007 Annual Report Download - page 50
Download and view the complete annual report
Please find page 50 of the 2007 National Grid annual report below. You can navigate through the pages in the report by either clicking on the pages listed below, or by using the keyword search tool below to find specific information within the annual report.-
 1
1 -
2
-
3
-
4
-
5
-
6
-
7
-
8
-
9
-
10
-
11
-
12
-
13
-
14
-
15
-
16
-
17
-
18
-
19
-
20
-
21
-
22
-
23
-
24
-
25
-
26
-
27
-
28
-
29
-
30
-
31
-
32
-
33
-
34
-
35
-
36
-
37
-
38
-
39
-
 40
40 -
 41
41 -
 42
42 -
 43
43 -
 44
44 -
 45
45 -
 46
46 -
 47
47 -
 48
48 -
 49
49 -
 50
50 -
 51
51 -
 52
52 -
 53
53 -
 54
54 -
 55
55 -
 56
56 -
 57
57 -
 58
58 -
 59
59 -
 60
60 -
61
-
62
-
63
-
64
-
65
-
66
-
67
-
68
-
69
-
70
-
71
-
72
-
73
-
74
-
75
-
76
-
77
-
78
-
79
-
80
-
81
-
82
-
83
-
84
-
85
-
86
 |
 |

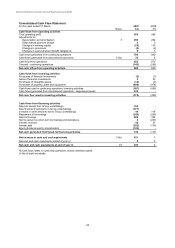
National Grid Electricity Transmission plc Annual Report and Accounts 2006/07
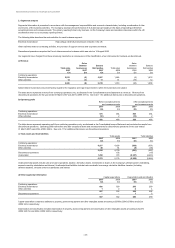
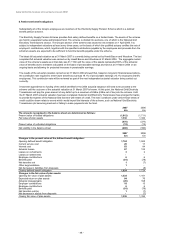
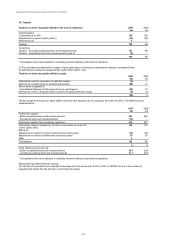
2. Segmental analysis
Segmental information is presented in accordance with the management responsibilities and economic characteristics, including consideration of risks
and returns, of the business activities. The Company assesses the performance of its businesses principally on the basis of operating profit before
exceptional items and remeasurements. The primary reporting format is by business. All the Company's sales and operations take place within the UK
and therefore there is no secondary reporting format.
The following table describes the main activities for each business segment:
Electricity transmission High-voltage electricity transmission networks in the UK
Other activities relate to contracting activities, the provision of support services and corporate overheads.
Discontinued operations comprise the French interconnnectors business which was sold on 14 August 2006.
Our segments have changed from those previously reported as a consequence of the classification of our interconnector business as discontinued.
a) Revenue
Sales Sales
between Sales to between Sales to
Total sales businesses third parties Total sales businesses third parties
2007 2007 2007 2006 2006 2006
£m £m £m £m £m £m
Continuing operations:
Electricity transmission 2,012 (5) 2,007 1,885 (9) 1,876
Other activities 14 (3) 11 31 (19) 12
2,026 (8) 2,018 1,916 (28) 1,888
Sales between businesses are priced having regard to the regulatory and legal requirements to which the businesses are subject.
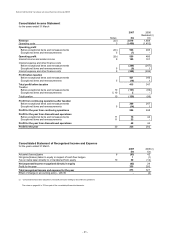
The table above represents revenue from continuing operations only, as disclosed in the Consolidated Income Statement as 'revenue'. Revenue from
discontinued operations for the year ended 31 March 2007 was £27m (2006: £77m). See note 11 for additional disclosures on discontinued operations.
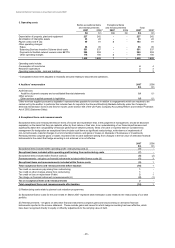
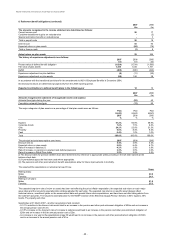
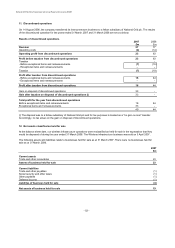
b) Operating profit
Before exceptional items After exceptional items
and remeasurements and remeasurements
2007 2006 2007 2006
£m £m £m £m
Continuing operations:
Electricity transmission 576 484 569 484
Other activities (10) 2(10) 2
566 486 559 486
The table above represents operating profit from continuing operations only, as disclosed in the Consolidated Income Statement and excludes the results from
discontinued operations. Operating profit both before and after exceptional items and remeasurements for discontinued operations for the year ended
31 March 2007 was £23m (2006: £63m). See note 11 for additional disclosures on discontinued operations.
c) Total assets and total liabilities
Total assets Total liabilities
2007 2006 2007 2006
£m £m £m £m
Continuing operations:
Electricity transmission 4,977 4,636 (586) (551)
Other activities 48 64 (5) (36)
5,025 4,700 (591) (587)
Discontinued operations -102 -(16)
Unallocated 1,250 376 (5,347) (4,443)
6,275 5,178 (5,938) (5,046)
Unallocated total assets include cash and cash equivalents, taxation, derivative assets, investments in shares in the Company's ultimate parent undertaking,
amounts owed by subsidiaries and interest. Unallocated total liabilities include bank overdrafts, borrowings, derivative liabilities, taxation (including
deferred taxation), amounts owed to subsidiaries and interest.
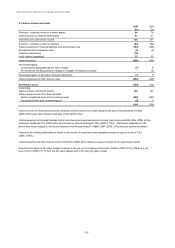
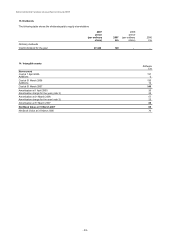
d) Other segmental information
Capital expenditure Depreciation and amortisation
2007 2006 2007 2006
£m £m £m £m
Continuing operations:
Electricity transmission 606 530 245 260
Other activities 1244
607 532 249 264
Discontinued operations --15
607 532 250 269
Capital expenditure comprises additions to property, plant and equipment and other intangible assets amounting to £595m (2006: £530m) and £12m
(2006: £2m) respectively.
Depreciation and amortisation includes depreciation of property, plant and equipment and amortisation of other intangible assets amounting to £227m
(2006: £247m) and £23m (2006: £22m) respectively.
- 45 -