National Grid 2007 Annual Report Download - page 20
Download and view the complete annual report
Please find page 20 of the 2007 National Grid annual report below. You can navigate through the pages in the report by either clicking on the pages listed below, or by using the keyword search tool below to find specific information within the annual report.-
 1
1 -
2
-
3
-
4
-
5
-
6
-
7
-
8
-
9
-
 10
10 -
 11
11 -
 12
12 -
 13
13 -
 14
14 -
 15
15 -
 16
16 -
 17
17 -
 18
18 -
 19
19 -
 20
20 -
 21
21 -
 22
22 -
 23
23 -
 24
24 -
 25
25 -
 26
26 -
 27
27 -
 28
28 -
 29
29 -
 30
30 -
31
-
32
-
33
-
34
-
35
-
36
-
37
-
38
-
39
-
40
-
41
-
42
-
43
-
44
-
45
-
46
-
47
-
48
-
49
-
50
-
51
-
52
-
53
-
54
-
55
-
56
-
57
-
58
-
59
-
60
-
61
-
62
-
63
-
64
-
65
-
66
-
67
-
68
-
69
-
70
-
71
-
72
-
73
-
74
-
75
-
76
-
77
-
78
-
79
-
80
-
81
-
82
-
83
-
84
-
85
-
86
 |
 |

18 National Grid Electricity Transmission Annual Report and Accounts 2006/07
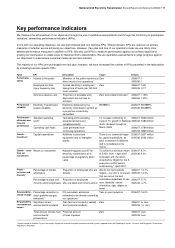
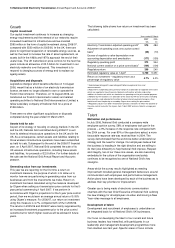
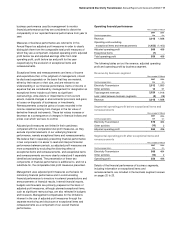
Revenue, operating costs and operating profit
The movements in the year in revenue, operating costs and
operating profit can be summarised as follows:
Revenue
Operating
costs
Operating
profit
Continuing operations £m
£m
£m
2005/06 results 1,888
(1,402)
486
Add back 2005/06 exceptional
items and remeasurements -
-
-
2005/06 adjusted results 1,888
(1,402)
486
Electricity Transmission 127
(35)
92
Other activities (17)
5
(12)
Sales between businesses 20
(20)
-
2006/07 adjusted results 2,018
(1,452)
566
2006/07 exceptional items
and remeasurements -
(7)
(7)
2006/07 results 2,018
(1,459)
559
Revenue was £130 million higher than in 2005/06, primarily as
a result of higher Electricity Transmission revenue. Operating
costs, excluding exceptional items and remeasurements,
increased by £50 million as a result of higher operating costs in
the Electricity Transmission business. As a consequence,
adjusted operating profit was £80 million higher than 2005/06.
Net operating exceptional charges of £7 million in 2006/07
relate to restructuring costs, including the establishment of a UK
shared services function and the transmission business process
review. There were no exceptional charges in 2005/06.
As a result of the £80 million increase in adjusted operating
profit, less the £7 million increase in operating exceptional
charges and remeasurements, total operating profit increased
by £73 million from 2005/06 to 2006/07.
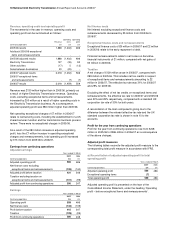
Earnings from continuing operations
Adjusted earnings
Years ended 31 March
2007
2006
Continuing operations £m
£m
Adjusted operating profit 566
486
Net finance costs excluding
exceptional items and remeasurements (135)
(140)
Adjusted profit before taxation 431
346
Taxation excluding taxation on
exceptional items and remeasurements (131)
(99)
Adjusted profit from continuing operations 300
247
Earnings
Years ended 31 March
2007
2006
Continuing operations £m
£m
Operating profit 559
486
Net finance costs (144)
(139)
Profit before taxation 415
347
Taxation (129)
(99)
Profit from continuing operations 286
248
Net finance costs
Net interest excluding exceptional finance costs and
remeasurements decreased by £5 million from 2005/06 to
2006/07.
Exceptional finance costs and remeasurements
Exceptional finance costs of £8 million in 2006/07 and £2 million
in 2005/06 relate to the early repayment of debt.
Financial remeasurements relate to net losses on derivative
financial instruments of £1 million, compared with net gains of
£3 million in 2005/06.
Taxation
A net charge of £129 million arose in 2006/07, compared with
£99 million in 2005/06. This includes net tax credits in respect
of exceptional items and remeasurements amounting to £2
million in 2006/07. The effective tax rate was 31% for 2006/07
and 29% for 2005/06.
Excluding the effect of net tax credits on exceptional items and
remeasurements, the effective tax rate for 2006/07 and 2005/06
was 30% and 29% respectively, compared with a standard UK
corporation tax rate of 30% for both years.
A reconciliation of the main components giving rise to the
difference between the relevant effective tax rate and the UK
standard corporation tax rate is shown in note 10 to the
accounts.
Profit for the year from continuing operations
Profit for the year from continuing operations rose from £248
million in 2005/06 to £286 million in 2006/07 as a consequence
of the above changes.
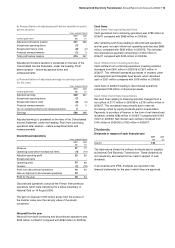
Adjusted profit measures
The following tables reconcile the adjusted profit measure to the
corresponding total profit measure in accordance with IFRS.
a) Reconciliation of adjusted operating profit to total
operating profit
Years ended 31 March
2007
2006
Continuing operations £m
£m
Adjusted operating profit 566
486
Exceptional operating items (7)
-
Total operating profit 559
486
Adjusted operating profit is presented on the face of the
Consolidated Income Statement, under the heading ‘Operating
profit – before exceptional items and remeasurements’.