National Grid 2007 Annual Report Download - page 64
Download and view the complete annual report
Please find page 64 of the 2007 National Grid annual report below. You can navigate through the pages in the report by either clicking on the pages listed below, or by using the keyword search tool below to find specific information within the annual report.-
 1
1 -
2
-
3
-
4
-
5
-
6
-
7
-
8
-
9
-
10
-
11
-
12
-
13
-
14
-
15
-
16
-
17
-
18
-
19
-
20
-
21
-
22
-
23
-
24
-
25
-
26
-
27
-
28
-
29
-
30
-
31
-
32
-
33
-
34
-
35
-
36
-
37
-
38
-
39
-
40
-
41
-
42
-
43
-
44
-
45
-
46
-
47
-
48
-
49
-
50
-
51
-
52
-
53
-
 54
54 -
 55
55 -
 56
56 -
 57
57 -
 58
58 -
 59
59 -
 60
60 -
 61
61 -
 62
62 -
 63
63 -
 64
64 -
 65
65 -
 66
66 -
 67
67 -
 68
68 -
 69
69 -
 70
70 -
 71
71 -
 72
72 -
 73
73 -
 74
74 -
75
-
76
-
77
-
78
-
79
-
80
-
81
-
82
-
83
-
84
-
85
-
86
 |
 |

National Grid Electricity Transmission plc Annual Report and Accounts 2006/07
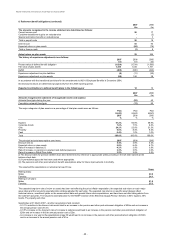
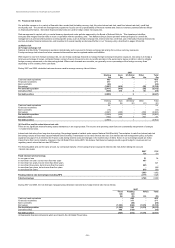
19. Financial risk factors (continued)
(a) Market risk (continued)
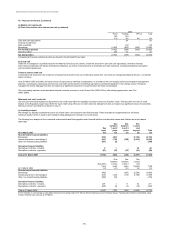
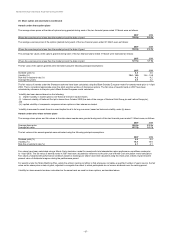
(ii) Cash flow and fair value interest rate risk (continued)
Fixed
Floating
RPI
(i)
Total
rate
rate
£m
£m
£m
£m
Cash and cash equivalents
-
24
-
24
Financial investments
-
-
-
-
Bank overdrafts
-
(16)
-
(16)
Borrowings
(1,662)
(402)
(926)
(2,990)
Pre-derivative position
(1,662)
(394)
(926)
(2,982)
Derivative effect
(35)
55
-
20
Net debt position
(1,697)
(339)
(926)
(2,962)
(i) Represents financial instruments which are linked to the UK Retail Prices Index.
(b) Credit risk
Credit risk is managed on a portfolio basis for the National Grid Group as a whole. Credit risk arises from cash and cash equivalents, derivative financial
instruments and deposits with banks and financial institutions, as well as credit exposures to wholesale and retail customers, including outstanding receivables
and committed transactions.
Treasury related credit risk
Counterparty risk arises from the investment of surplus funds and from the use of derivative instruments. Our limits are managed by National Grid plc, our ultimate
parent company.
As at 31 March 2007 and 2006, we had a number of exposures to individual counterparties. In accordance with our treasury policies and exposure management
practices, counterparty credit exposure limits are continually monitored and no individual exposure is considered significant in the ordinary course of treasury
management activity. Management does not expect any significant losses from non-performance by these counterparties.
The counterparty exposure under derivative financial contracts as shown in note 18 was £5m (2006: £40m), after netting agreements it was £1m
(2006: £38m).
Wholesale and retail credit risk
Our principal commercial exposure is governed by the credit rules within the regulated Connection and Use of System Code. This lays down the level of credit
relative to the Regulatory Asset Value (RAV) for each credit rating. We have no retail credit risk. Mangement does not expect any significant losses of receivables
that have not been provided for as shown in note 21.
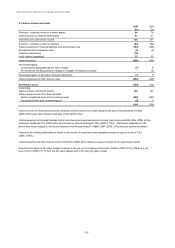
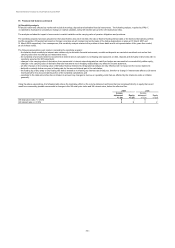
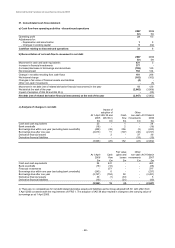
(c) Liquidity analysis
We manage our liquidity requirements by the use of both short- and long-term cash flow forecasts. These forecasts are supplemented by a financial
headroom position which is used to demonstrate funding adequacy for at least a 12-month period.
The following is an analysis of the contractual undiscounted cash flows payable under financial liabilities and derivative assets and liabilities as at the balance
sheet date:
Due
Due
Due
between
between
3 years
Due
1 and 2
2 and 3
and
1 year
years
years
beyond
Total
At 31 March 2007
£m
£m
£m
£m
£m
Non-derivative financial liabilities
Borrowings
(195)
(407)
-
(3,123)
(3,725)
Interest payments on borrowings (i)
(141)
(135)
(128)
(2,418)
(2,822)
Other non-interest bearing liabilities
(791)
(8)
-
-
(799)
Derivative financial liabilities
Deriviatives contracts - receipts
2
1
-
25
28
Deriviatives contracts - payments
(21)
(16)
(10)
(41)
(88)
Total at 31 March 2007
(1,146)
(565)
(138)
(5,557)
(7,406)
Due
Due
Due
between
between
3 years
Due within
1 and 2
2 and 3
and
1 year
years
years
beyond
Total
At 31 March 2006
£m
£m
£m
£m
£m
Non derivative financial liabilities
Borrowings
(365)
-
(427)
(2,266)
(3,058)
Interest payments on borrowings (i)
(125)
(123)
(115)
(1,596)
(1,959)
Other non-interest bearing liabilities
(699)
(35)
-
-
(734)
Derivative financial liabilities
Deriviatives contracts - receipts
207
1
11
52
271
Deriviatives contracts - payments (225) (8) (3) (16) (252)
Total at 31 March 2006
(1,207)
(165)
(534)
(3,826)
(5,732)
(i) The interest on borrowings is calculated based on borrowings held at 31 March without taking account of futures issues. Floating-rate interest is estimated using
a future interest rate curve as at 31 March.
2006
- 59 -