National Grid 2007 Annual Report Download - page 26
Download and view the complete annual report
Please find page 26 of the 2007 National Grid annual report below. You can navigate through the pages in the report by either clicking on the pages listed below, or by using the keyword search tool below to find specific information within the annual report.-
 1
1 -
2
-
3
-
4
-
5
-
6
-
7
-
8
-
9
-
10
-
11
-
12
-
13
-
14
-
15
-
 16
16 -
 17
17 -
 18
18 -
 19
19 -
 20
20 -
 21
21 -
 22
22 -
 23
23 -
 24
24 -
 25
25 -
 26
26 -
 27
27 -
 28
28 -
 29
29 -
 30
30 -
 31
31 -
 32
32 -
 33
33 -
 34
34 -
 35
35 -
 36
36 -
37
-
38
-
39
-
40
-
41
-
42
-
43
-
44
-
45
-
46
-
47
-
48
-
49
-
50
-
51
-
52
-
53
-
54
-
55
-
56
-
57
-
58
-
59
-
60
-
61
-
62
-
63
-
64
-
65
-
66
-
67
-
68
-
69
-
70
-
71
-
72
-
73
-
74
-
75
-
76
-
77
-
78
-
79
-
80
-
81
-
82
-
83
-
84
-
85
-
86
 |
 |

24 National Grid Electricity Transmission Annual Report and Accounts 2006/07
Financial position and
financial management
Going concern
Having made enquiries, the Directors consider that the
Company and its subsidiaries have adequate resources to
continue in business for the foreseeable future and that it is
therefore appropriate to adopt the going concern basis in
preparing the accounts.
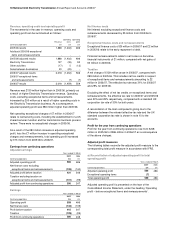
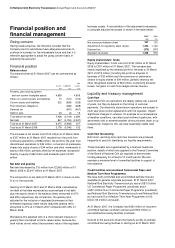
Financial position
Balance sheet
Our balance sheet at 31 March 2007 can be summarised as
follows:
Assets
Liabilities
Net
assets
£m
£m
£m
Property, plant and equipment
and non-current intangible assets 4,858
-
4,858
Other non-current assets and liabilities 15
(147)
(132)
Current assets and liabilities 532
(858)
(326)
Post retirement obligations -
(488)
(488)
Deferred tax -
(647)
(647)
Held for sale 23
(4)
19
Total before net debt 5,428
(2,144)
3,284
Net debt 847
(3,794)
(2,947)
Total as at 31 March 2007 6,275
(5,938)
337
Total as at 31 March 2006 5,178
(5,046)
132
The increase in net assets from £132 million at 31 March 2006
to £337 million at 31 March 2007 resulted from the profit from
continuing operations of £286 million, the profit for the year from
discontinued operations of £49 million, conversion of preference
shares into equity shares of £44 million and other movements in
equity of £8 million, partially offset by net expenses recognised
directly in equity of £62 million and dividends paid of £120
million.
Net debt and gearing
Net debt decreased by £15 million from £2,962 million at 31
March 2006 to £2,947 million at 31 March 2007.
The composition of net debt at 31 March 2007 is shown in note
31(c) to the accounts.
Gearing at 31 March 2007 and 31 March 2006, calculated as
net debt at that date expressed as a percentage of net debt
plus net assets shown in the balance sheet, amounted to 47%
and 49% respectively. By comparison, the gearing ratio,
adjusted for the inclusion of regulated businesses at their
estimated regulatory asset values (adjusted gearing ratio),
amounted to 41% at 31 March 2007 compared with 43% 31
March 2006.
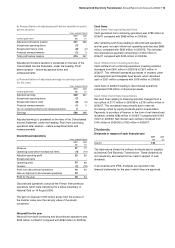
We believe this adjusted ratio is a more relevant measure of
gearing than one based on book values alone, because the
book values do not reflect the economic value of the regulated
business assets. A reconciliation of the adjustments necessary
to calculate adjusted net assets is shown in the table below:
2007
2006
£m
£m
Net assets per balance sheet 337
132
Adjustments for regulatory asset values 1,244
1,124
Deferred tax (373)
(337)
Adjusted net assets 1,208
919
Equity shareholders’ funds
Equity shareholders’ funds rose from £132 million at 31 March
2006 to £337 million at 31 March 2007. The increase was
mainly explained by the retained profit for the year to 31 March
2007 of £215 million (including the profit on disposal of
business of £33 million) and the conversion of preference
shares to equity shares of £44 million, partially offset by net
other recognised expense of £62 million, comprising actuarial
losses, net gains on cash flow hedges and tax thereon.
Liquidity and treasury management
Cash flow
Cash flows from our operations are largely stable over a period
of years, but they do depend on the timing of customer
payments. Our electricity transmission operations are subject to
multi-year price control agreements with the regulator, Ofgem.
Significant changes in volumes, for example as a consequence
of weather conditions, can affect cash inflows in particular, with
abnormally mild or extreme weather driving volumes down or up
respectively. Subject to this, we have essentially stable cash
flows.
Cash flow forecasting
Both short- and long-term cash flow forecasts are produced
frequently to assist in identifying our liquidity requirements.
These forecasts are supplemented by a financial headroom
position, details of which are supplied to the Finance Committee
of the Board of National Grid plc regularly to demonstrate
funding adequacy for at least a 12 month period. We also
maintain a minimum level of committed facilities in support of
that objective.
Credit facilities and unutilised Commercial Paper and
Medium Term Note Programmes
We have both committed and uncommitted facilities that are
available for general corporate purposes. At 31 March 2007,
National Grid Electricity Transmission plc had a US$1.0 billion
US Commercial Paper Programme (unutilised) and a
US$1.0 billion Euro Commercial Paper Programme (unutilised);
and National Grid Electricity Transmission plc and National Grid
plc had a joint Euro Medium Term Note Programme of €12
billion (€3.2 billion unissued).
At 31 March 2007, the Company had £450 million of long term
committed facilities (undrawn) and around £500 million of
uncommitted borrowing facilities (undrawn).
Note 24 to the accounts shows the maturity profile of undrawn
committed borrowing facilities in sterling as at 31 March 2007.