National Grid 2007 Annual Report Download - page 13
Download and view the complete annual report
Please find page 13 of the 2007 National Grid annual report below. You can navigate through the pages in the report by either clicking on the pages listed below, or by using the keyword search tool below to find specific information within the annual report.-
 1
1 -
2
-
 3
3 -
 4
4 -
 5
5 -
 6
6 -
 7
7 -
 8
8 -
 9
9 -
 10
10 -
 11
11 -
 12
12 -
 13
13 -
 14
14 -
 15
15 -
 16
16 -
 17
17 -
 18
18 -
 19
19 -
 20
20 -
 21
21 -
 22
22 -
 23
23 -
24
-
25
-
26
-
27
-
28
-
29
-
30
-
31
-
32
-
33
-
34
-
35
-
36
-
37
-
38
-
39
-
40
-
41
-
42
-
43
-
44
-
45
-
46
-
47
-
48
-
49
-
50
-
51
-
52
-
53
-
54
-
55
-
56
-
57
-
58
-
59
-
60
-
61
-
62
-
63
-
64
-
65
-
66
-
67
-
68
-
69
-
70
-
71
-
72
-
73
-
74
-
75
-
76
-
77
-
78
-
79
-
80
-
81
-
82
-
83
-
84
-
85
-
86
 |
 |

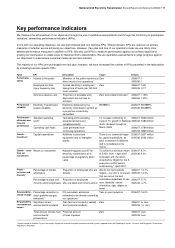
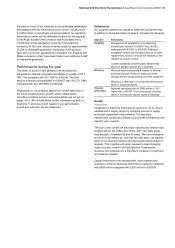
National Grid Electricity Transmission Annual Report and Accounts 2006/07 11
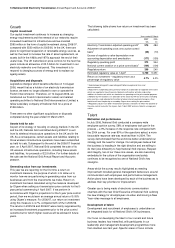
Key performance indicators
We measure the achievement of our objectives through the use of qualitative assessments and through the monitoring of quantitative
indicators, termed key performance indicators (KPIs).
In line with our operating objectives, we use both financial and non-financial KPIs. Where relevant, KPIs are used as our primary
measures of whether we are achieving our objectives. However, the scale and size of our operations mean we use many other
detailed performance measures in addition to KPIs. We also use KPIs to measure performance against our primary objective of
growing our businesses to create value for National Grid’s shareholders. We use qualitative assessments to judge progress against
our objectives in areas where numerical measures are less relevant.
The majority of our KPIs are unchanged from last year; however, we have increased the number of KPIs presented in the table below
by including business-specific KPIs.
Value KPI Description Target Results
Injuries to the public
Members of the public injured as a
direct result of our operations1
Zero 2006/07: 1
2005/06: 1
Employee lost time
injury frequency rate
Injuries resulting in employees
taking time off work (per 100,000
hours worked)
Zero 2006/07: 0.20
2005/06: 0.17
Performance –
safety
Sickness absence rate Proportion of available work
days which are lost due to
sickness
Zero work-related sickness2 2006/07: 1.39%
2005/06: 1.87%
Performance –
reliability
Electricity Transmission
system reliability
Electricity delivered by the
electricity transmission system as
a proportion of electricity
demanded
99.9999% 2006/07: 99.9999%
2005/06: 99.9999%
Adjusted operating
profit3
Operating profit excluding
exceptional items and
remeasurements
2006/07: £566 million
2005/06: £486 million
Performance –
efficiency and
financial
performance Operating cash flows Cash generated from
continuing operations
To increase sufficiently to
support 7% growth in National
Grid’s dividend through to
March 2008 2006/07: £789 million
2005/06: £869 million
Growth –
Investment
Capital expenditure Additions to plant and
equipment and to intangible
assets
There is no numerical target
for capital expenditure, as
each investment is different
and is considered on its
merits.
2006/07: £607 million
2005/06: £532 million
Growth – value
from our
investments
Return on investment Adjusted regulatory profit4 for
electricity transmission as a
percentage of regulatory asset
value
To achieve a minimum return
of 5.05% from 1 April 2007
consistent with the return
projected by Ofgem for the 5-
year price control period
commencing 1 April 2007.
2006/07: 4.7%
2005/06: 4.5%
Percentage of female
employees
Proportion of employees who are
female
2006/07: 13.7%
2005/06: 14.3%
People –
inclusion and
diversity
Percentage of black and
minority ethnic employees
Proportion of employees
who are black and minority ethnic
We do not have specific
targets – our aim is to ensure
that we recruit the best
candidates regardless of sex,
race, disability, sexual
orientation, age, religion or
belief
2006/07: 5.7%
2005/06: 4.7%
Responsibility –
climate change
Percentage reduction in
direct greenhouse gas
emissions5
CO2 equivalent emissions
estimated to be directly caused by
our operations
Year on year reduction 2006/07: 16.5%
Significant direct
environmental incidents
Own fault and contractor related
environmental incidents
Zero 2006/07: 6, zero
2005/06: 10, zero
Responsibility –
environmental
impact
Total amount of fines from
environmental
prosecutions
Financial amount
of fines imposed
Zero 2006/07: zero
2005/06: zero
1 Injuries comprise fatalities, injuries that require the person to receive hospital treatment and other injuries reported under the Reporting of Injuries, Diseases and Dangerous Occurrences
Regulations (RIDDOR).