National Grid 2007 Annual Report Download - page 71
Download and view the complete annual report
Please find page 71 of the 2007 National Grid annual report below. You can navigate through the pages in the report by either clicking on the pages listed below, or by using the keyword search tool below to find specific information within the annual report.-
 1
1 -
2
-
3
-
4
-
5
-
6
-
7
-
8
-
9
-
10
-
11
-
12
-
13
-
14
-
15
-
16
-
17
-
18
-
19
-
20
-
21
-
22
-
23
-
24
-
25
-
26
-
27
-
28
-
29
-
30
-
31
-
32
-
33
-
34
-
35
-
36
-
37
-
38
-
39
-
40
-
41
-
42
-
43
-
44
-
45
-
46
-
47
-
48
-
49
-
50
-
51
-
52
-
53
-
54
-
55
-
56
-
57
-
58
-
59
-
60
-
 61
61 -
 62
62 -
 63
63 -
 64
64 -
 65
65 -
 66
66 -
 67
67 -
 68
68 -
 69
69 -
 70
70 -
 71
71 -
 72
72 -
 73
73 -
 74
74 -
 75
75 -
 76
76 -
 77
77 -
 78
78 -
 79
79 -
 80
80 -
 81
81 -
82
-
83
-
84
-
85
-
86
 |
 |

National Grid Electricity Transmission plc Annual Report and Accounts 2006/07
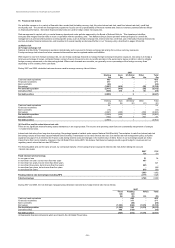
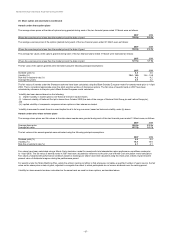
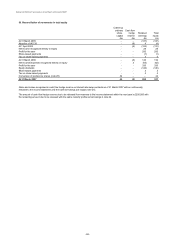
29. Share option and award plans (continued)
Movements in options to subscribe for ordinary shares under the various option schemes for the two years ended 31 March 2007
are shown below and include those options related to shares issued to employee benefit trusts:
Total
options
Weighted Weighted
average price average price
£ per share millions £ per share millions millions
At 1 April 2005
3.54 5.7 4.77 4.2 9.9
Staff transferred
-
-
3.88
1.0
1.0
Granted 4.34 1.0 - - 1.0
Lapsed - expired 4.01 (0.3) 5.16 (0.4) (0.7)
Exercised 3.78 (0.8) 3.91 (1.4) (2.2)
At 31 March 2006
3.63
5.6
4.81
3.4
9.0
Granted 5.58 0.8 - - 0.8
Lapsed - expired 4.44 (0.3) 5.36 (1.0) (1.3)
Exercised 3.67 -4.46 (0.4) (0.4)
At 31 March 2007
3.86
6.1
4.61
2.0
8.1
Included within options outstanding at 31 March 2007 and 31 March 2006 were the following options which were exercisable:
At 31 March 2007
3.17
0.8
4.42
1.4
2.2
At 31 March 2006 3.50 0.1 4.84 3.3 3.4
The weighted average remaining contractual life of options in the employee Sharesave scheme at 31 March 2007 was 1 year and 10 months.
These options have exercise prices between £3.17 and £5.58.
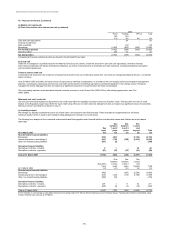
The weighted average share price at the exercise dates were as follows:
2007
2006
Sharesave scheme options
6.97
5.64
Executive Plan options
6.67
5.41
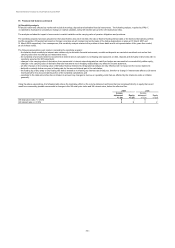
Options outstanding and exercisable and their weighted average exercise prices for the respective ranges of exercise prices and years at 31 March
2007 are as follows:
Weighted average Number Weighted average Number Exercise price Normal dates
exercise price of exercisable exercise price of outstanding per share of exercise
exercisable options millions outstanding options millions pence years
Executive plan
2.81 0.2 2.81 0.2 280.5 2001 - 2008
3.84 0.2 3.76 0.2 375.8 - 490.0 2002 - 2009
4.42 0.1 4.55 0.1 435.8 - 455.3 2003 - 2010
5.31 0.7 5.32 0.7 526.0 - 531.5 2004 - 2011
4.73 0.8 4.82 0.8 460.3 - 481.5 2006 - 2013
4.42
2.0
4.61
2.0
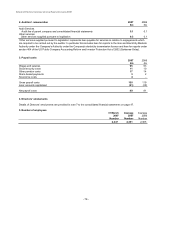
Share-based payment charges
Under IFRS, a charge is made to the income statement based on the fair value of grants in accordance with
IFRS 2 'Share-based Payment'. All share awards are equity settled.
The charge to the income statement for the year ended 31 March 2007 was £3m (2006: £2m).
Sharesave Executive Plan
scheme options options
- 66 -