Macy's 2009 Annual Report Download - page 92
Download and view the complete annual report
Please find page 92 of the 2009 Macy's annual report below. You can navigate through the pages in the report by either clicking on the pages listed below, or by using the keyword search tool below to find specific information within the annual report.-
 1
1 -
2
-
3
-
4
-
5
-
6
-
7
-
8
-
9
-
10
-
11
-
12
-
13
-
14
-
15
-
16
-
17
-
18
-
19
-
20
-
21
-
22
-
23
-
24
-
25
-
26
-
27
-
28
-
29
-
30
-
31
-
32
-
33
-
34
-
35
-
36
-
37
-
38
-
39
-
40
-
41
-
42
-
43
-
44
-
45
-
46
-
47
-
48
-
49
-
50
-
51
-
52
-
53
-
54
-
55
-
56
-
57
-
58
-
59
-
60
-
61
-
62
-
63
-
64
-
65
-
66
-
67
-
68
-
69
-
70
-
71
-
72
-
73
-
74
-
75
-
76
-
77
-
78
-
79
-
80
-
81
-
 82
82 -
 83
83 -
 84
84 -
 85
85 -
 86
86 -
 87
87 -
 88
88 -
 89
89 -
 90
90 -
 91
91 -
 92
92 -
 93
93 -
 94
94 -
 95
95 -
 96
96 -
 97
97 -
 98
98 -
 99
99 -
 100
100 -
 101
101 -
 102
102 -
103
-
104
-
105
-
106
-
107
-
108
-
109
-
110
-
111
-
112
 |
 |

NOTES TO CONSOLIDATED FINANCIAL STATEMENTS — (Continued)
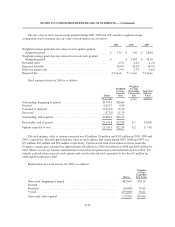
The fair value of stock-based awards granted during 2009, 2008 and 2007 and the weighted average
assumptions used to estimate the fair value of stock options are as follows:
2009 2008 2007
Weighted average grant date fair value of stock options granted
during the period ........................................... $ 2.51 $ 7.42 $ 16.64
Weighted average grant date fair value of restricted stock granted
during the period ........................................... $ – $ 24.85 $ 44.10
Dividend yield ............................................... 2.3% 2.2% 1.2%
Expected volatility ............................................ 36.4% 36.2% 36.9%
Risk-free interest rate ......................................... 1.9% 2.7% 4.6%
Expected life ................................................ 5.4years 5.3 years 5.3 years
Stock option activity for 2009 is as follows:
Shares
Weighted
Average
Exercise
Price
Weighted
Average
Remaining
Contractual
Life
Aggregate
Intrinsic
Value
(thousands) (years) (millions)
Outstanding, beginning of period .......................... 38,794.4 $28.64
Granted .............................................. 6,091.7 8.80
Canceled or forfeited .................................... (5,554.2) 30.24
Exercised ............................................. (527.0) 15.79
Outstanding, end of period ............................... 38,804.9 $25.47
Exercisable, end of period ................................ 25,474.8 $27.08 4.1 $(284)
Options expected to vest ................................. 11,730.5 $22.39 8.2 $ (76)
The total intrinsic value of options exercised was $2 million, $1 million and $145 million in 2009, 2008 and
2007, respectively. The total grant-date fair value of stock options that vested during 2009, 2008 and 2007 was
$71 million, $65 million and $54 million, respectively. Cash received from stock option exercises under the
Company’s equity plan amounted to approximately $8 million for 2009, $6 million for 2008 and $204 million for
2007. There were no tax benefits realized from exercised stock options and vested restricted stock for 2009. Tax
benefits realized from exercised stock options and vested restricted stock amounted to less than $1 million for
2008 and $51 million for 2007.
Restricted stock award activity for 2009 is as follows:
Shares
Weighted
Average
Grant Date
Fair Value
Nonvested, beginning of period .................................... 482,864 $34.18
Granted ....................................................... – –
Forfeited ...................................................... (10,000) 35.83
Vested ........................................................ (293,808) 34.44
Nonvested, end of period .......................................... 179,056 $33.66
F-44