Macy's 2009 Annual Report Download - page 69
Download and view the complete annual report
Please find page 69 of the 2009 Macy's annual report below. You can navigate through the pages in the report by either clicking on the pages listed below, or by using the keyword search tool below to find specific information within the annual report.
NOTES TO CONSOLIDATED FINANCIAL STATEMENTS — (Continued)
services. The amounts earned under the Program Agreement related to the servicing functions are deemed
adequate compensation and, accordingly, no servicing asset or liability has been recorded on the Consolidated
Balance Sheets.
Amounts received under the Program Agreement were $525 million for 2009, $594 million for 2008, and
$661 million for 2007, and are treated as reductions of selling, general and administrative expenses on the
Consolidated Statements of Operations. The Company’s earnings from credit operations, net of servicing
expenses, were $323 million for 2009, $372 million for 2008, and $450 million for 2007.
8. Inventories
Merchandise inventories were $4,615 million at January 30, 2010, compared to $4,769 million at
January 31, 2009. At these dates, the cost of inventories using the LIFO method approximated the cost of such
inventories using the FIFO method. The application of the LIFO method did not impact cost of sales for 2009,
2008 or 2007.
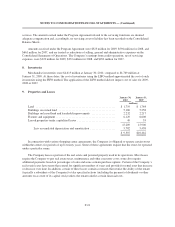
9. Properties and Leases
January 30,
2010
January 31,
2009
(millions)
Land ........................................................ $ 1,719 $ 1,764
Buildings on owned land ........................................ 5,160 5,258
Buildings on leased land and leasehold improvements ................. 2,232 2,217
Fixtures and equipment .......................................... 6,129 6,608
Leased properties under capitalized leases ........................... 49 53
15,289 15,900
Less accumulated depreciation and amortization .................. 5,782 5,458
$ 9,507 $10,442
In connection with various shopping center agreements, the Company is obligated to operate certain stores
within the centers for periods of up to twenty years. Some of these agreements require that the stores be operated
under a particular name.
The Company leases a portion of the real estate and personal property used in its operations. Most leases
require the Company to pay real estate taxes, maintenance and other executory costs; some also require
additional payments based on percentages of sales and some contain purchase options. Certain of the Company’s
real estate leases have terms that extend for significant numbers of years and provide for rental rates that increase
or decrease over time. In addition, certain of these leases contain covenants that restrict the ability of the tenant
(typically a subsidiary of the Company) to take specified actions (including the payment of dividends or other
amounts on account of its capital stock) unless the tenant satisfies certain financial tests.
F-21


