Macy's 2009 Annual Report Download - page 20
Download and view the complete annual report
Please find page 20 of the 2009 Macy's annual report below. You can navigate through the pages in the report by either clicking on the pages listed below, or by using the keyword search tool below to find specific information within the annual report.-
 1
1 -
2
-
3
-
4
-
5
-
6
-
7
-
8
-
9
-
 10
10 -
 11
11 -
 12
12 -
 13
13 -
 14
14 -
 15
15 -
 16
16 -
 17
17 -
 18
18 -
 19
19 -
 20
20 -
 21
21 -
 22
22 -
 23
23 -
 24
24 -
 25
25 -
 26
26 -
 27
27 -
 28
28 -
 29
29 -
 30
30 -
31
-
32
-
33
-
34
-
35
-
36
-
37
-
38
-
39
-
40
-
41
-
42
-
43
-
44
-
45
-
46
-
47
-
48
-
49
-
50
-
51
-
52
-
53
-
54
-
55
-
56
-
57
-
58
-
59
-
60
-
61
-
62
-
63
-
64
-
65
-
66
-
67
-
68
-
69
-
70
-
71
-
72
-
73
-
74
-
75
-
76
-
77
-
78
-
79
-
80
-
81
-
82
-
83
-
84
-
85
-
86
-
87
-
88
-
89
-
90
-
91
-
92
-
93
-
94
-
95
-
96
-
97
-
98
-
99
-
100
-
101
-
102
-
103
-
104
-
105
-
106
-
107
-
108
-
109
-
110
-
111
-
112
 |
 |

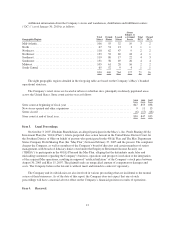
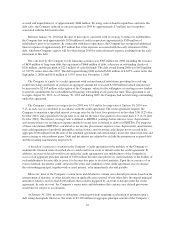
The following graph compares the cumulative total stockholder return on the Common Stock with the
Standard & Poor’s 500 Composite Index and the Standard & Poor’s Retail Department Store Index for the period
from January 28, 2005 through January 29, 2010, assuming an initial investment of $100 and the reinvestment of
all dividends, if any.
$0
$50
$100
$150
$200
201020092008200720062005
M
S&P 500 Retail Department Stores
S&P 500
The companies included in the S&P Retail Department Store Index are Dillard’s, Macy’s, J.C. Penney,
Kohl’s, Nordstrom and Sears, as well as May for the periods of January 28, 2005 to August 29, 2005.
14