Honda 2016 Annual Report Download - page 5
Download and view the complete annual report
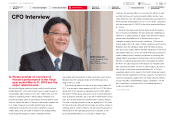
Please find page 5 of the 2016 Honda annual report below. You can navigate through the pages in the report by either clicking on the pages listed below, or by using the keyword search tool below to find specific information within the annual report.-
 1
1 -
 2
2 -
 3
3 -
 4
4 -
 5
5 -
 6
6 -
 7
7 -
 8
8 -
 9
9 -
 10
10 -
 11
11 -
 12
12 -
 13
13 -
 14
14 -
 15
15 -
 16
16 -
17
-
18
-
19
-
20
-
21
-
22
-
23
-
24
-
25
-
26
-
27
-
28
-
29
-
30
-
31
-
32
-
33
-
34
-
35
-
36
-
37
-
38
-
39
-
40
 |
 |

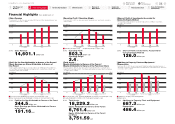
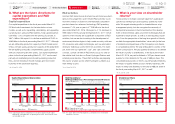
Sales Revenue
* From fiscal 2012 to 2013, the above was named “Net Sales and Other Operating Revenue” and
stated in accordance with U.S. GAAP.
Yen (billions)
Profit for the Year Attributable to Owners of the Parent /
Basic Earnings per Share Attributable to Owners of
the Parent
* From fiscal 2012 to 2013, the above were named “Net Income Attributable to Honda Motor Co.,
Ltd.” and “Basic Net Income Attributable to Honda Motor Co., Ltd. per Common Share”, and
stated in accordance with U.S. GAAP.
Yen (billions) (Yen)
Operating Profit / Operating Margin
* From fiscal 2012 to 2013, the above was named “Operating Income” and stated in accordance
with U.S. GAAP.
Yen (billions) (%)
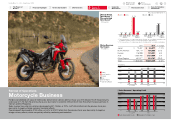
Total Assets /
Equity Attributable to Owners of the Parent /
Equity Attributable to Owners of the Parent per Share
* From fiscal 2012 to 2013, the above were named “Total Honda Motor Co., Ltd. Shareholders’
Equity” and “Total Honda Motor Co., Ltd. Shareholders’ Equity per Common Share”, and stated in
accordance with U.S. GAAP.
Yen (billions) (Yen)
Share of Profit of Investments Accounted for
Using the Equity Method
* From fiscal 2012 to 2013, the above was named “Equity in Income of Affiliates” and stated in
accordance with U.S. GAAP.
Yen (billions)
Additions to Property, Plant and Equipment /
Depreciation
* From fiscal 2012 to 2013, the above were named “Capital Expenditures (Excluding Purchase of
Operating Lease Assets)” and “Depreciation (Excluding Property on Operating Leases)”, and stated
in accordance with U.S. GAAP.
Yen (billions)
2016 Operating Profit
503.3 billion yen
Operating Margin
3.4 %
2016 Additions to Property, Plant and Equipment
687.3 billion yen
Depreciation
486.4 billion yen
2016 Total Assets
18,229.2 billion yen
Equity Attributable to Owners of the Parent
6,761.4 billion yen
Equity Attributable to Owners of the Parent
per Share
3,751.59 yen
2016 Profit for the Year Attributable to Owners of the Parent
344.5 billion yen
Basic Earnings per Share Attributable to Owners
of the Parent
191.16 yen
2016 Sales Revenue
14,601.1 billion yen
2016 Share of Profit of Investments Accounted for
Using the Equity Method
126.0 billion yen
Operating Profit (left scale) Operating Margin (%) (right scale)
Additions to Property, Plant and Equipment
Depreciation
Total Assets (left scale) Equity Attributable to Owners of the Parent (left scale)
Equity Attributable to Owners of the Parent per Share (right scale)
Profit for the Year Attributable to Owners of the Parent (left scale)
Basic Earnings per Share Attributable to Owners of the Parent (right scale)
Financial Highlights Years ended March 31
5,000
10,000
15,000
012 13 14 15 16
200
400
600
800
0
100
200
300
400
0
12 13 14 15 16
500
250
750
1,000
0
4.0
2.0
6.0
8.0
0
12 13 14 15 16
10,000
5,000
15,000
20,000
0
2,000
1,000
3,000
4,000
0
12 13 14 15 16
50
100
150
012 13 14 15 16
400
600
200
800
012 13 14 15 16
U.S. GAAP IFRS
U.S. GAAP IFRS
U.S. GAAP IFRS
U.S. GAAP IFRS
U.S. GAAP IFRS
U.S. GAAP IFRS
Honda Motor Co., Ltd. Annual Report 2016 04
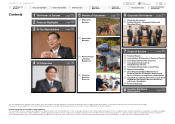
2Financial Highlights
Return to last
page opened
Go to
contents page
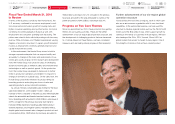
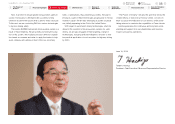
3To Our Shareholders
4CFO Interview
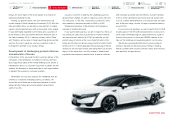
5Review of
Operations
6Corporate
Governance
7Financial Section
8Investor Relations
Information
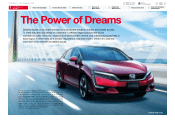
1The Power of
Dreams