Honda 2016 Annual Report Download - page 36
Download and view the complete annual report
Please find page 36 of the 2016 Honda annual report below. You can navigate through the pages in the report by either clicking on the pages listed below, or by using the keyword search tool below to find specific information within the annual report.-
 1
1 -
2
-
3
-
4
-
5
-
6
-
7
-
8
-
9
-
10
-
11
-
12
-
13
-
14
-
15
-
16
-
17
-
18
-
19
-
20
-
21
-
22
-
23
-
24
-
25
-
 26
26 -
 27
27 -
 28
28 -
 29
29 -
 30
30 -
 31
31 -
 32
32 -
 33
33 -
 34
34 -
 35
35 -
 36
36 -
 37
37 -
 38
38 -
 39
39 -
 40
40
 |
 |
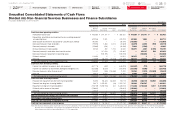
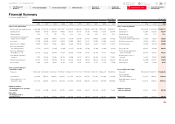
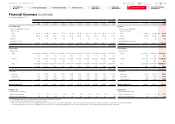
Unaudited Consolidated Statements of Cash Flows
Divided into Non-financial Services Businesses and Finance Subsidiaries
Fiscal years ended March 31, 2015 and 2016 Yen (millions)
2015 2016
Non-financial
Services
Businesses
Finance
Subsidiaries
Reconciling
Items Consolidated
Non-financial
Services
Businesses
Finance
Subsidiaries
Reconciling
Items Consolidated
Cash flows from operating activities:
Profit before income taxes ¥ 592,086 ¥ 214,151 ¥ — ¥ 806,237 ¥ 419,309 ¥ 216,141 ¥ — ¥ 635,450
Depreciation, amortization and impairment losses excluding equipment
on operating leases 622,238 2,991 —625,229 657,856 2,858 —660,714
Share of profit of investments accounted for using the equity method (96,097) — — (96,097) (126,001) — — (126,001)
Decrease (increase) in trade receivables (55,694) 1,383 8,472 (45,839) (83,670) (3,601) (902) (88,173)
Decrease (increase) in inventories (55,882) (403) —(56,285) 73,943 (7,538) —66,405
Increase (decrease) in trade payables 20,132 352 1,762 22,246 103,276 4,608 (2,695) 105,189
Decrease (increase) in receivables from financial services —317,033 (71) 316,962 —354,147 206 354,353
Decrease (increase) in equipment on operating leases —(535,165) —(535,165) —(558,826) —(558,826)
Dividends received 114,499 2 — 114,501 105,475 2 — 105,477
Other, net (72,899) (48,238) (10,248) (131,385) 280,338 (47,443) 3,512 236,407
Net cash provided by (used in) operating activities 1,068,383 (47,894) (85) 1,020,404 1,430,526 (39,652) 121 1,390,995
Cash flows from investing activities:
Payments for additions to property, plant and equipment (647,773) (432) —(648,205) (634,457) (719) —(635,176)
Payments for additions to and internally developed intangible assets (231,280) (3,635) —(234,915) (232,393) (4,390) —(236,783)
Decrease (increase) in other financial assets* 145,452 (948) (133,480) 11,024 135,263 (1,918) (161,692) (28,347)
Other, net 26,970 4,630 —31,600 22,499 2,730 —25,229
Net cash provided by (used in) investing activities (706,631) (385) (133,480) (840,496) (709,088) (4,297) (161,692) (875,077)
Cash flows from financing activities:
Proceeds from (repayment of) short-term financing liabilities* 54,692 (58,331) 133,358 129,719 (64,922) (488,127) 146,960 (406,089)
Proceeds from long-term financing liabilities* 53,375 1,452,391 (34) 1,505,732 120,484 1,706,507 —1,826,991
Repayments of long-term financing liabilities* (106,769) (1,282,593) 241 (1,389,121) (113,463) (1,168,438) 14,611 (1,267,290)
Dividends paid to owners of the parent (158,601) — — (158,601) (158,601) — — (158,601)
Other, net (75,241) — — (75,241) (90,310) — — (90,310)
Net cash provided by (used in) financing activities (232,544) 111,467 133,565 12,488 (306,812) 49,942 161,571 (95,299)
Effect of exchange rate changes on cash and cash equivalents 77,335 8,415 —85,750 (126,261) (8,632) —(134,893)
Net change in cash and cash equivalents 206,543 71,603 —278,146 288,365 (2,639) —285,726
Cash and cash equivalents at beginning of period 1,171,991 21,593 —1,193,584 1,378,534 93,196 —1,471,730
Cash and cash equivalents at end of period ¥1,378,534 ¥ 93,196 ¥ — ¥ 1,471,730 ¥1,666,899 ¥ 90,557 ¥ — ¥ 1,757,456
Note: Non-financial services businesses provide loans to finance subsidiaries. These cash flows are included in the decrease (increase) in other financial assets, proceeds from (repayment of) short-term financing liabilities,
proceeds from and repayment of long-term financing liabilities (marked by *). The amount of the loans to finance subsidiaries is a ¥133,480 million decrease for the fiscal year ended March 31, 2015, and a ¥161,692
million decrease for the fiscal year ended March 31, 2016, respectively.
Honda Motor Co., Ltd. Annual Report 2016 35
7Financial Section
Return to last
page opened
Go to
contents page
1The Power of
Dreams
2Financial Highlights
3To Our Shareholders
4CFO Interview
5Review of
Operations
6Corporate
Governance
8Investor Relations
Information