Honda 2016 Annual Report Download - page 37
Download and view the complete annual report
Please find page 37 of the 2016 Honda annual report below. You can navigate through the pages in the report by either clicking on the pages listed below, or by using the keyword search tool below to find specific information within the annual report.-
 1
1 -
2
-
3
-
4
-
5
-
6
-
7
-
8
-
9
-
10
-
11
-
12
-
13
-
14
-
15
-
16
-
17
-
18
-
19
-
20
-
21
-
22
-
23
-
24
-
25
-
26
-
 27
27 -
 28
28 -
 29
29 -
 30
30 -
 31
31 -
 32
32 -
 33
33 -
 34
34 -
 35
35 -
 36
36 -
 37
37 -
 38
38 -
 39
39 -
 40
40
 |
 |

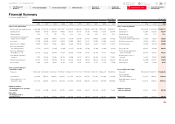
Financial Summary
Fiscal years ended March 31
Yen (millions) Yen (millions)
U.S. GAAP IFRS
2006 2007 2008 2009 2010 2011 2012 2013 2014 2015 2014 2015 2016
Sales, income and dividends Sales, income and dividends
Net sales and other operating revenue ¥ 9,907,996 ¥11,087,140 ¥12,002,834 ¥10,011,241 ¥ 8,579,174 ¥ 8,936,867 ¥ 7,948,095 ¥ 9,877,947 ¥11,842,451 ¥12,646,747 Sales revenue ¥12,506,091 ¥13,328,099 ¥14,601,151
Operating income 868,905 851,879 953,109 189,643 363,775 569,775 231,364 544,810 750,281 606,878 Operating profit 823,864 670,603 503,376
Operating margin 8.8% 7.7% 7.9% 1.9% 4.2% 6.4% 2.9% 5.5% 6.3% 4.8% Operating margin 6.6% 5.0% 3.4%
Income before income taxes and
equity in income of affiliates 829,904 792,868 895,841 161,734 336,198 630,548 257,403 488,891 728,940 644,809
Share of profit of investments
accounted for using the equity method 130,916 96,097 126,001
Income taxes 317,189 283,846 387,436 109,835 146,869 206,827 135,735 178,976 252,662 235,204 Profit before income taxes 933,903 806,237 635,450
Equity in income of affiliates 99,605 103,417 118,942 99,034 93,282 139,756 100,406 82,723 132,471 126,570 Income tax expense 267,992 245,139 229,092
Net income attributable to
noncontrolling interests (15,287) (20,117) (27,308) (13,928) (14,211) (29,389) (10,592) (25,489) (34,642) (43,168) Profit for the year 665,911 561,098 406,358
Net income attributable to
Honda Motor Co., Ltd. 597,033 592,322 600,039 137,005 268,400 534,088 211,482 367,149 574,107 493,007
Profit for the year attributable to
owners of the parent 624,703 509,435 344,531
Cash dividends paid during
the period 71,061 140,482 152,590 139,724 61,696 92,170 108,138 129,765 142,381 158,601
Dividends paid to owners of
the parent 142,381 158,601 158,601
Research and development 510,385 551,847 587,959 563,197 463,354 487,591 519,818 560,270 634,130 662,610 R&D expenditure 625,698 670,331 719,810
Interest expense 11,902 12,912 16,623 22,543 12,552 8,474 10,378 12,157 12,703 16,598 Interest expense 12,803 18,194 18,146
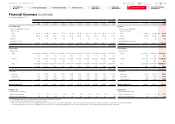
Assets, long-term debt and
shareholders’ equity Assets, liabilities and equity
Total assets ¥10,631,400 ¥12,036,500 ¥12,615,543 ¥11,818,917 ¥11,629,115 ¥11,577,714 ¥11,787,599 ¥13,635,357 ¥15,622,031 ¥18,088,839 Total assets ¥16,048,438 ¥18,425,837 ¥18,229,294
Long-term debt 1,879,000 1,905,743 1,836,652 1,932,637 2,313,035 2,043,240 2,235,001 2,710,845 3,234,066 3,933,860
Financing liabilities
(Non-current liabilities) 3,224,512 3,926,276 3,736,628
Total Honda Motor Co., Ltd.
shareholders’ equity 4,125,750 4,488,825 4,550,479 4,007,288 4,328,640 4,439,587 4,398,249 5,043,500 5,918,979 6,696,693
Equity attributable to owners of
the parent 6,335,534 7,108,627 6,761,433
Capital expenditures
(excluding purchase of operating
lease assets) 457,841 627,066 654,030 633,913 348,981 326,620 424,413 630,408 782,027 714,502
Additions to property,
plant and equipment 803,231 703,920 687,306
Depreciation
(excluding property on
operating leases) 262,225 361,747 417,393 441,868 401,743 377,272 345,105 335,536 442,318 490,375 Depreciation 419,022 451,052 486,410
Honda Motor Co., Ltd. Annual Report 2016 36
7Financial Section
Return to last
page opened
Go to
contents page
1The Power of
Dreams
2Financial Highlights
3To Our Shareholders
4CFO Interview
5Review of
Operations
6Corporate
Governance
8Investor Relations
Information