Honda 2016 Annual Report Download - page 11
Download and view the complete annual report
Please find page 11 of the 2016 Honda annual report below. You can navigate through the pages in the report by either clicking on the pages listed below, or by using the keyword search tool below to find specific information within the annual report.
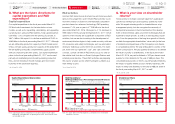
Q. What are the future directions for
capital expenditure and R&D
expenditure?
Capital expenditure
Our capital expenditure in the fiscal year ended March 31,
2016 included investments for the introduction of new
models, as well as for expanding, rationalizing, and upgrading
our production, sales and R&D facilities. Total capital expendi-
ture fell by 1.0% compared with the previous fiscal year, to
¥647.4 billion. We expect it to decline an additional 13.5% to
¥560 billion in the fiscal year ending March 31, 2017*. Although
we are still lacking production capacity in North America and
China, we have surplus production capacity at the global level.
We are building a mutually complementary supply system
without constructing any new plants. Our capital expenditure
plans for the fiscal year ending March 31, 2017 are focused
primarily on maintaining and renovating existing production
lines, and on investing in model changes and new model
launches in the automobile business.
* As of June 16, 2016
R&D activities
Honda’s R&D divisions are structured as autonomous subsid-
iaries to encourage free, open-minded R&D activities to pro-
mote the creation of distinctive, internationally competitive
products based on advanced technology. R&D spending
increased 7.4% year on year to ¥719.8 billion in the fiscal
year ended March 31, 2016. We expect a 4.1% decrease to
¥690 billion in the fiscal year ending March 31, 2017*. Devel-
opment of new models are a significant component of R&D
activities, but we are also investing in the development of
environmental technologies to help create a society with zero
CO2 emissions and safety technologies such as automated
driving for realizing a society free from accidents. For exam-
ple, in line with our “generate”, “use”, and “get connected”
concept, our fuel cell vehicle R&D efforts focus not only on
the vehicle itself, but also on Smart Hydrogen Stations and
external power devices. These R&D activities are preparing
the way for a future society where hydrogen is utilized as a
main energy source.
* As of June 16, 2016
Q. What is your view on shareholder
returns?
Honda strives to increase corporate value from a global per-
spective by developing its local business operations world-
wide. We regard returning profits to shareholders as a top
management priority, but also recognize the necessity of
having internal reserves to fund investments in the develop-
ment of environmental, safety, and other technologies that are
essential for future growth, as well as to fund business expan-
sion. From the perspective of the long-term growth of Honda,
we think the appropriate shareholders’ return ratio (in the form
of dividends and repurchases of the Company’s own shares)
to consolidated profit for the year attributable to owners of the
parent is around 30%. We pay quarterly dividends to accelerate
the return of profits to shareholders. In the fiscal year ended
March 31, 2016, we paid a dividend of ¥22 per share in each
quarter, for total dividends for the year of ¥88 per share. The
consolidated payout ratio of 46.0% was temporarily inflated by
the impact of quality related product warranty expenses. We
expect to keep total dividends for the year at ¥88 per share in
the fiscal year ending March 31, 2017 as well*.
* As of June 16, 2016
Yen (billions)
Capital Expenditures/Depreciation
Years ended March 31
Capital Expenditures Depreciation
250
500
750
012 13 14 15 16
Note: Capital Expenditure and Depreciation in the above graph exclude Capital
Expenditure and Depreciation in operating lease assets, financial lease assets,
and intangible assets.
Note: This figure differs from R&D expenses as itemized in the consolidated
statement of income.
U.S. GAAP IFRS
Yen (billions) (%)
R&D Expenditure/
R&D Expenditure as a Percentage of Sales Revenues
Years ended March 31
R&D Expenditure (left scale)
R&D Expenditure as a Percentage of Sales Revenues (right scale)
200
600
400
800
0
2
6
4
8
0
12 13 14 15 16
U.S. GAAP IFRS
(Yen)
Dividend per Share
Years ended March 31
25
75
50
100
012 13 14 15 16
* From 2012 to 2013, the above was named “R&D
expenses” and stated in accordance with U.S. GAAP.
Honda Motor Co., Ltd. Annual Report 2016 10
4CFO Interview
Return to last
page opened
Go to
contents page
2Financial Highlights
3To Our Shareholders
5Review of
Operations
6Corporate
Governance
7Financial Section
8Investor Relations
Information
1The Power of
Dreams

