Honda 2016 Annual Report Download - page 21
Download and view the complete annual report
Please find page 21 of the 2016 Honda annual report below. You can navigate through the pages in the report by either clicking on the pages listed below, or by using the keyword search tool below to find specific information within the annual report.-
 1
1 -
2
-
3
-
4
-
5
-
6
-
7
-
8
-
9
-
10
-
 11
11 -
 12
12 -
 13
13 -
 14
14 -
 15
15 -
 16
16 -
 17
17 -
 18
18 -
 19
19 -
 20
20 -
 21
21 -
 22
22 -
 23
23 -
 24
24 -
 25
25 -
 26
26 -
 27
27 -
 28
28 -
 29
29 -
 30
30 -
 31
31 -
32
-
33
-
34
-
35
-
36
-
37
-
38
-
39
-
40
 |
 |

12 13 14 15 16
15.0
30.0
60.0
45.0
0.0
500
1,000
2,000
1,500
0
(Fiscal years ended March 31)
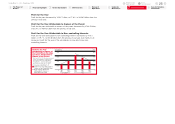
2015 2016 % change
Japan ¥ 119,722 ¥ 162,056 35.4 %
North America 1,376,287 1,619,201 17.6
Europe 14,249 14,490 1.7
Asia 12,157 12,615 3.8
Other Regions 33,135 27,243 (17.8)
Total ¥1,555,550 ¥1,835,605 18.0 %
Sales Revenue
by Region
Yen (millions)
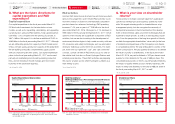
Yen (billions) 2012 2013 2014 2015 2016
Receivables from
Financial Services ¥3,446.1 ¥4,031.1 ¥5,351.2 ¥5,683.6 ¥5,008.0
Equipment on
Operating Leases 1,472.7 1,843.1 2,427.4 3,335.3 3,678.1
Total ¥4,918.8 ¥5,874.2 ¥7,778.6 ¥9,018.9 ¥8,686.1
Receivables from Financial Services / Equipment on Operating Leases
* From fiscal 2012 to 2013, the above were named “Finance Receivables” and “Property on Operating Leases”, and stated in
accordance with U.S. GAAP.
Total receivables from financial services and equipment on operating leases of finance subsidiaries on March
31, 2016 decreased by ¥332.7 billion, or 3.7%, to ¥8,686.1 billion from March 31, 2015. Honda estimates
that by applying Japanese yen exchange rates of the previous fiscal year to the current fiscal year, the total
amount of receivables from financial services and equipment on operating leases of finance subsidiaries as
of March 31, 2016 would have increased by approximately ¥236.0 billion, or 2.6%, compared to the
decrease as reported of ¥332.7 billion, which includes negative foreign currency translation effects.
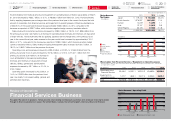
Sales revenue from external customers increased by ¥280.0 billion, or 18.0%, to ¥1,835.6 billion from
the previous fiscal year, due mainly to an increase in operating lease revenues and revenues on disposition
of lease vehicles. Honda estimates that by applying Japanese yen exchange rates of the previous fiscal
year to the current fiscal year, sales revenue for the year would have increased by approximately ¥151.1
billion, or 9.7%, compared to the increase as reported of ¥280.0 billion, which includes positive foreign
currency translation effects. Sales revenue including intersegment sales increased by ¥281.7 billion, or
18.0%, to ¥1,849.7 billion from the previous fiscal year.
Operating costs and expenses increased by ¥285.0 billion, or 20.9%, to ¥1,650.3 billion from the
previous fiscal year. Cost of sales increased by ¥275.2 billion, or 21.6%, to ¥1,547.1 billion from the
previous fiscal year, due mainly to an increase in
costs attributable to increased operating lease
revenues and revenues on disposition of lease
vehicles. Selling, general and administrative
expenses increased by ¥9.7 billion, or 10.4%, to
¥103.1 billion.
Operating profit decreased by ¥3.2 billion, or
1.6%, to ¥199.3 billion from the previous fiscal
year, due mainly to increased selling, general and
administrative expenses.
Review of Operations
Financial Services Business
To support the sale of its products, Honda provides retail lending and leasing to customers and wholesale financing to dealers
through its finance subsidiaries in Japan, the United States, Canada, the United Kingdom, Germany, Brazil and Thailand.
Japan
North America
Europe
Asia
Other Regions
Operating Margin
U.S. GAAP IFRS
U.S. GAAP IFRS
500
1,500
2,000
012 13 14 15 16
100
300
1,000 200
400
0
Sales Revenue / Operating Profit
Yen (billions)
Sales Revenue (left scale) Operating Profit (right scale)
Yen (billions) (%)
Honda Motor Co., Ltd. Annual Report 2016 20
5Review of
Operations
Return to last
page opened
Go to
contents page
2Financial Highlights
3To Our Shareholders
4CFO Interview
6Corporate
Governance
7Financial Section
8Investor Relations
Information
1The Power of
Dreams