Honda 2016 Annual Report Download - page 34
Download and view the complete annual report
Please find page 34 of the 2016 Honda annual report below. You can navigate through the pages in the report by either clicking on the pages listed below, or by using the keyword search tool below to find specific information within the annual report.-
 1
1 -
2
-
3
-
4
-
5
-
6
-
7
-
8
-
9
-
10
-
11
-
12
-
13
-
14
-
15
-
16
-
17
-
18
-
19
-
20
-
21
-
22
-
23
-
 24
24 -
 25
25 -
 26
26 -
 27
27 -
 28
28 -
 29
29 -
 30
30 -
 31
31 -
 32
32 -
 33
33 -
 34
34 -
 35
35 -
 36
36 -
 37
37 -
 38
38 -
 39
39 -
 40
40
 |
 |
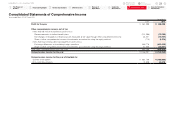
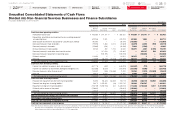
Honda has four reportable segments: Motorcycle business, Automobile business, Financial services business and Power product and other businesses, which are based
on Honda’s organizational structure and characteristics of products and services. Operating segments are defined as the components of Honda for which separate
financial information is available that is evaluated regularly by the chief operating decision maker in deciding how to allocate resources and in assessing performance.
The accounting policies used for these reportable segments are consistent with the accounting policies used in the Company’s consolidated financial statements.
Segment Information
Segment information as of and for the years ended March 31, 2015 and 2016 is as follows:
As of and for the year ended March 31, 2015
Yen (millions)
Motorcycle
Business
Automobile
Business
Financial
Services
Business
Power Product
and Other
Businesses
Segment
Total
Reconciling
Items Consolidated
Sales revenue:
External customers ¥1,846,666 ¥9,603,335 ¥1,555,550 ¥322,548 ¥13,328,099 ¥ — ¥13,328,099
Intersegment —154,536 12,363 24,362 191,261 (191,261) —
Total 1,846,666 9,757,871 1,567,913 346,910 13,519,360 (191,261) 13,328,099
Segment profit (loss) 192,154 279,756 202,574 (3,881) 670,603 —670,603
Segment assets 1,489,703 7,653,645 9,318,545 334,858 18,796,751 (370,914) 18,425,837
Depreciation and amortization 70,881 525,522 484,526 12,061 1,092,990 —1,092,990
Capital expenditures 87,762 791,626 1,685,245 14,588 2,579,221 —2,579,221
As of and for the year ended March 31, 2016
Yen (millions)
Motorcycle
Business
Automobile
Business
Financial
Services
Business
Power Product
and Other
Businesses
Segment
Total
Reconciling
Items Consolidated
Sales revenue:
External customers ¥1,805,429 ¥10,625,405 ¥1,835,605 ¥334,712 ¥14,601,151 ¥ — ¥14,601,151
Intersegment —142,280 14,095 17,532 173,907 (173,907) —
Total 1,805,429 10,767,685 1,849,700 352,244 14,775,058 (173,907) 14,601,151
Segment profit (loss) 181,773 153,366 199,358 (31,121) 503,376 —503,376
Segment assets 1,412,404 7,493,086 9,071,874 333,586 18,310,950 (81,656) 18,229,294
Depreciation and amortization 76,267 564,631 622,874 13,770 1,277,542 —1,277,542
Capital expenditures 73,541 796,209 1,972,647 18,251 2,860,648 —2,860,648
Explanatory notes:
1. Intersegment sales revenues are generally made at values that approximate arm’s-length prices.
2. Reconciling items include elimination of intersegment transactions and balances as well as unallocated corporate assets. Unallocated corporate assets, included in reconciling items as of March 31, 2015 and 2016
amounted to ¥345,266 million and ¥451,387 million, respectively, which consist primarily of the Company’s cash and cash equivalents and financial assets measured at fair value through other comprehensive income.
Segment Information
Honda Motor Co., Ltd. Annual Report 2016 33
7Financial Section
Return to last
page opened
Go to
contents page
1The Power of
Dreams
2Financial Highlights
3To Our Shareholders
4CFO Interview
5Review of
Operations
6Corporate
Governance
8Investor Relations
Information