Honda 2016 Annual Report Download - page 38
Download and view the complete annual report
Please find page 38 of the 2016 Honda annual report below. You can navigate through the pages in the report by either clicking on the pages listed below, or by using the keyword search tool below to find specific information within the annual report.-
 1
1 -
2
-
3
-
4
-
5
-
6
-
7
-
8
-
9
-
10
-
11
-
12
-
13
-
14
-
15
-
16
-
17
-
18
-
19
-
20
-
21
-
22
-
23
-
24
-
25
-
26
-
27
-
 28
28 -
 29
29 -
 30
30 -
 31
31 -
 32
32 -
 33
33 -
 34
34 -
 35
35 -
 36
36 -
 37
37 -
 38
38 -
 39
39 -
 40
40
 |
 |
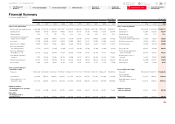
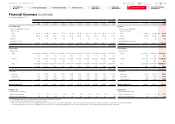
Financial Summary (continued)
Fiscal years ended March 31
Yen Yen
U.S. GAAP IFRS
2006 2007 2008 2009 2010 2011 2012 2013 2014 2015 2014 2015 2016
Per common share Per share
Net income attributable to Honda
Motor Co., Ltd.:
Profit for the year attributable to
owners of the parent
Basic ¥ 324.33 ¥ 324.62 ¥ 330.54 ¥ 75.50 ¥ 147.91 ¥ 295.67 ¥ 117.34 ¥ 203.71 ¥ 318.54 ¥ 273.54 Basic ¥ 346.62 ¥ 282.66 ¥ 191.16
Diluted 324.33 324.62 330.54 75.50 147.91 295.67 117.34 203.71 318.54 273.54 Diluted 346.62 282.66 191.16
Dividends 50 67 86 63 38 54 60 76 82 88 Dividends 82 88 88
Honda Motor Co., Ltd.
shareholders’ equity 2,259.26 2,463.69 2,507.79 2,208.35 2,385.45 2,463.29 2,440.35 2,798.37 3,284.14 3,715.66
Equity attributable to owners of
the parent 3,515.27 3,944.23 3,751.59
Yen (millions) Yen (millions)
Sales progress Sales progress
Sales amounts:*1Sales revenue:*1
Japan ¥ 1,694,044 ¥ 1,681,190 ¥ 1,585,777 ¥ 1,446,541 ¥ 1,577,318 ¥ 1,503,842 ¥ 1,517,927 ¥ 1,652,995 ¥ 1,912,504 ¥ 1,810,283 Japan ¥ 1,920,114 ¥ 1,800,439 ¥1,754,167
17% 15% 13% 14% 18% 17% 19% 17% 16% 14% 15% 14% 12%
Overseas 8,213,952 9,405,950 10,417,057 8,564,700 7,001,856 7,433,025 6,430,168 8,224,952 9,929,947 10,836,464 Overseas 10,585,977 11,527,660 12,846,984
83% 85% 87% 86% 82% 83% 81% 83% 84% 86% 85% 86% 88%
Total ¥ 9,907,996 ¥11,087,140 ¥12,002,834 ¥10,011,241 ¥ 8,579,174 ¥ 8,936,867 ¥ 7,948,095 ¥ 9,877,947 ¥11,842,451 ¥12,646,747 Total ¥12,506,091 ¥13,328,099 ¥14,601,151
100% 100% 100% 100% 100% 100% 100% 100% 100% 100% 100% 100% 100%
Thousands Thousands
Unit sales:*2Unit sales:*2
Motorcycles 10,271 10,369 9,320 10,114 9,639 18,331 15,061 15,494 17,021 17,765 Motorcycles 17,008 17,592 17,055
Automobiles 3,391 3,652 3,925 3,517 3,392 3,529 3,108 4,014 4,323 4,364 Automobiles 4,340 4,367 4,743
Power Products 5,876 6,421 6,057 5,187 4,744 5,509 5,819 6,071 6,036 6,001 Power Products 6,018 5,983 5,965
Number of employees 144,785 167,231 178,960 181,876 176,815 179,060 187,094 190,338 198,561 203,902 Number of employees 199,368 204,730 208,399
Exchange rate
(yen amounts per U.S. dollar)
Exchange rate
(yen amounts per U.S. dollar)
Rates for the period-end ¥ 117 ¥ 118 ¥ 100 ¥ 98 ¥ 93 ¥ 83 ¥ 82 ¥ 94 ¥ 103 ¥ 120 Rates for the period-end ¥ 103 ¥ 120 ¥ 113
Average rates for the period 113 117 114 101 93 86 79 83 100 110 Average rates for the period 100 110 120
*1 The geographic breakdown of sales amounts is based on the location of customers.
*2 Honda changed its counting method for unit sales as follows;
· 2006–2010: the total of unit sales of completed products of Honda and its consolidated subsidiaries, and sales of parts for local production at Honda’s affiliates accounted for using the equity method
· 2011–2016: the total of unit sales of completed products of Honda, its consolidated subsidiaries and its affiliates accounted for using the equity method (Honda Group Unit Sales)
Honda Motor Co., Ltd. Annual Report 2016 37
7Financial Section
Return to last
page opened
Go to
contents page
1The Power of
Dreams
2Financial Highlights
3To Our Shareholders
4CFO Interview
5Review of
Operations
6Corporate
Governance
8Investor Relations
Information