Honda 2016 Annual Report Download - page 19
Download and view the complete annual report
Please find page 19 of the 2016 Honda annual report below. You can navigate through the pages in the report by either clicking on the pages listed below, or by using the keyword search tool below to find specific information within the annual report.-
 1
1 -
2
-
3
-
4
-
5
-
6
-
7
-
8
-
 9
9 -
 10
10 -
 11
11 -
 12
12 -
 13
13 -
 14
14 -
 15
15 -
 16
16 -
 17
17 -
 18
18 -
 19
19 -
 20
20 -
 21
21 -
 22
22 -
 23
23 -
 24
24 -
 25
25 -
 26
26 -
 27
27 -
 28
28 -
 29
29 -
30
-
31
-
32
-
33
-
34
-
35
-
36
-
37
-
38
-
39
-
40
 |
 |
100
200
400
12 13 14 15 16
10.0
0 0.0
20.0
300 30.0
40.0
–10.0
(Fiscal years ended March 31)
Japan North
AmericaEurope Asia Other
Regions
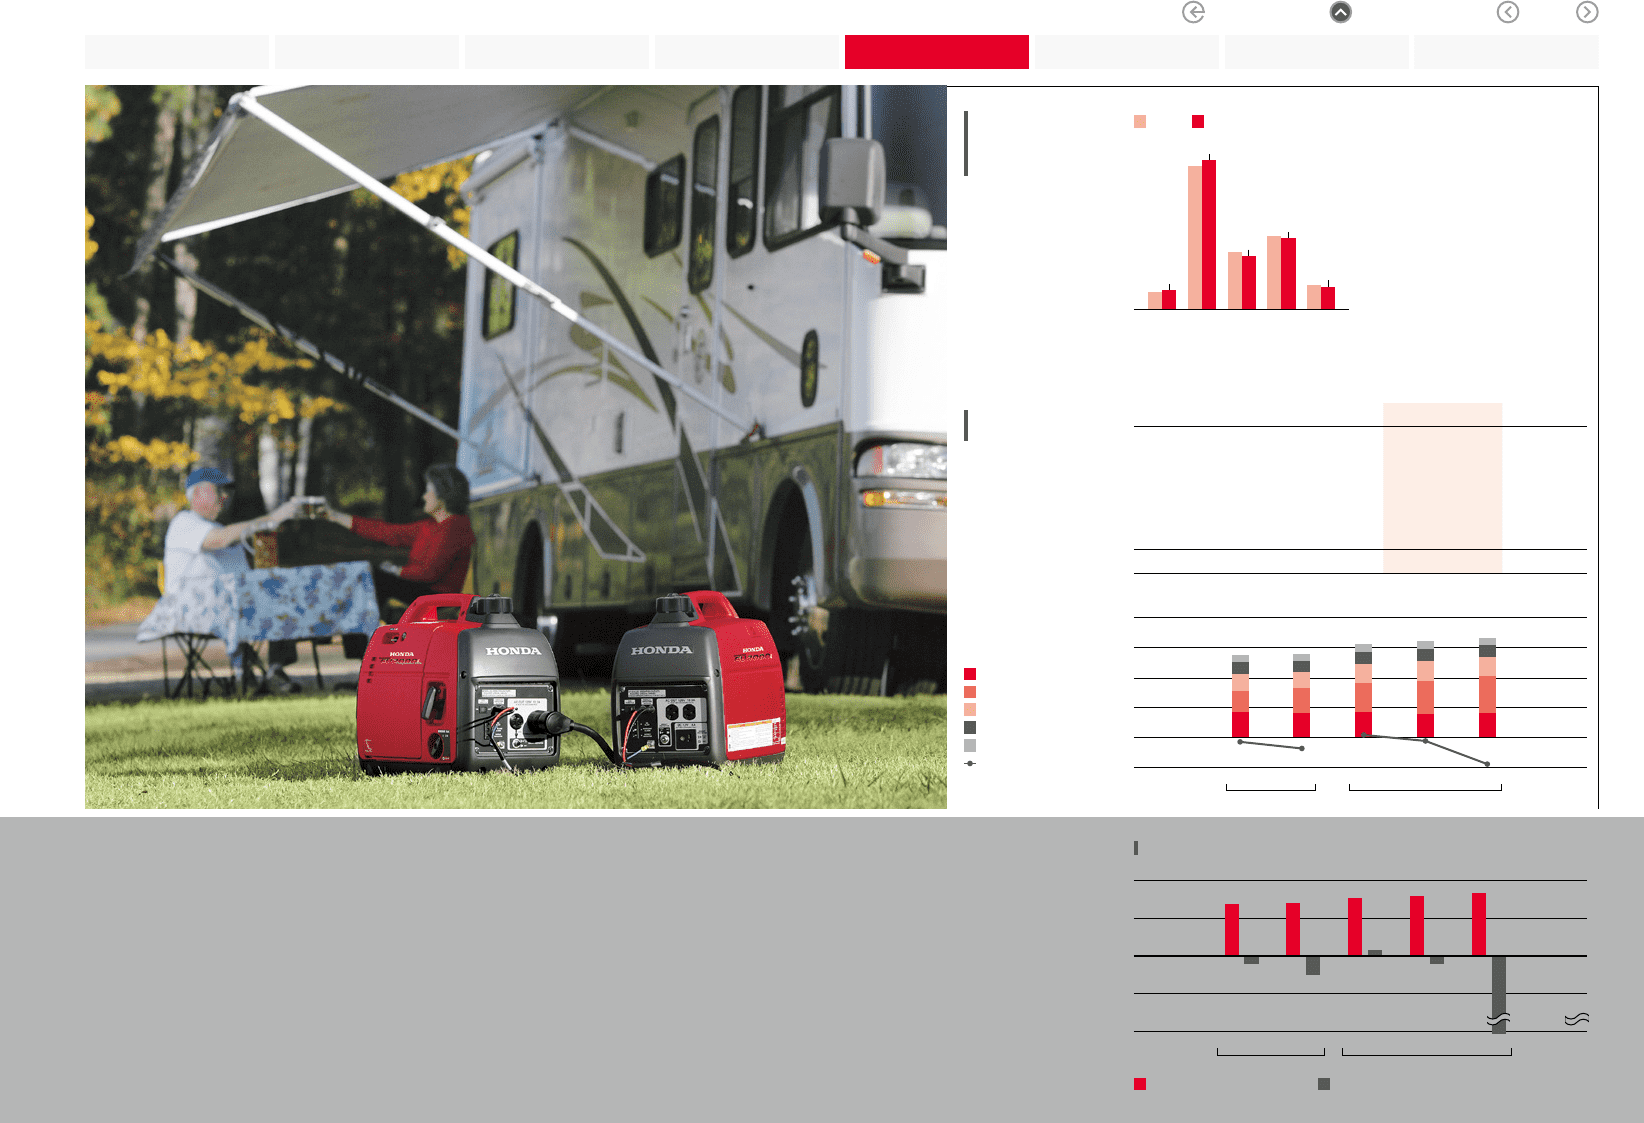
Honda Group
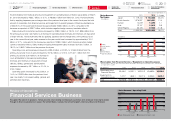
Unit Sales /
Consolidated
Unit Sales
(Thousands)
日本 北米 欧州
アジア その他
363
2,811
1,008
434
1,349
2015 2016 % change
Japan ¥ 82,176 ¥ 85,275 3.8 %
North America 107,615 122,079 13.4
Europe 67,536 62,883 (6.9)
Asia 40,632 41,282 1.6
Other Regions 24,589 23,193 (5.7)
Total ¥322,548 ¥334,712 3.8 %
Sales Revenue
by Region
Yen (millions)
Review of Operations
Power Product and Other Businesses
Honda’s consolidated unit sales of power products in fiscal year 2016 totaled 5,965 thousand units, a decrease of 0.3% from
the previous fiscal year primarily due to a decrease in sales in Europe which more than offset an increase in North America and
other countries.
Sales revenue from external customers increased by ¥12.1 billion, or 3.8%, to ¥334.7 billion from the previous fiscal year, due
mainly to increased sales revenue in Other businesses.
Operating loss was ¥31.1 billion, an increase of ¥27.2 billion from the previous fiscal year, due mainly to an increase in operating
costs in Other businesses.
Note: In power product business, there is no discrepancy between Honda Group Unit
Sales and Consolidated Unit Sales
Japan
North America
Europe
Asia
Other Regions
Operating Margin
U.S. GAAP IFRS
U.S. GAAP IFRS
2015 2016
Yen (billions) (%)
0
400
12 13 14 15 16
0
40
200 20
–300
–20
Sales Revenue / Operating Profit (Loss)
Yen (billions)
Sales Revenue (left scale) Operating Profit (Loss) (right scale)
EU2000i (Generator)
Honda Motor Co., Ltd. Annual Report 2016 18
5Review of
Operations
Return to last
page opened
Go to
contents page
2Financial Highlights
3To Our Shareholders
4CFO Interview
6Corporate
Governance
7Financial Section
8Investor Relations
Information
1The Power of
Dreams