Honda 2016 Annual Report Download - page 13
Download and view the complete annual report
Please find page 13 of the 2016 Honda annual report below. You can navigate through the pages in the report by either clicking on the pages listed below, or by using the keyword search tool below to find specific information within the annual report.-
 1
1 -
2
-
 3
3 -
 4
4 -
 5
5 -
 6
6 -
 7
7 -
 8
8 -
 9
9 -
 10
10 -
 11
11 -
 12
12 -
 13
13 -
 14
14 -
 15
15 -
 16
16 -
 17
17 -
 18
18 -
 19
19 -
 20
20 -
 21
21 -
 22
22 -
 23
23 -
24
-
25
-
26
-
27
-
28
-
29
-
30
-
31
-
32
-
33
-
34
-
35
-
36
-
37
-
38
-
39
-
40
 |
 |

日本 北米 欧州
アジア その他
180 308 204 1,230
15,133
日本 北米 欧州
アジア その他
180 308 204 1,230
8,650
500
1,500
1,000
2,000
012 13 14 15 16
3.0
6.0
9.0
12.0
0.0
(Fiscal years ended March 31)
Japan North
AmericaEurope Asia Other
Regions Japan North
AmericaEurope Asia Other
Regions
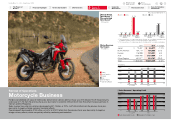
Review of Operations
Motorcycle Business
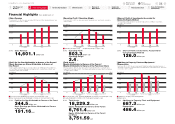
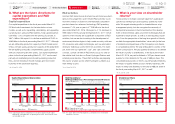
Honda’s consolidated unit sales of motorcycles and all-terrain vehicles (ATVs) in fiscal year 2016 totaled 10,572 thousand units,
a decrease of 1.4% from the previous fiscal year, due mainly to a decline in Brazil which more than offset increases primarily in
Vietnam and the Philippines.
Sales revenue from external customers decreased by ¥41.2 billion, or 2.2%, to ¥1,805.4 billion from the previous fiscal year,
due mainly to negative foreign currency translation effects.
Operating profit decreased by ¥10.3 billion, or 5.4%, to ¥181.7 billion from the previous fiscal year, due mainly to negative
foreign currency effects, which was partially offset by continuing cost reduction.
Japan
North America
Europe
Asia
Other Regions
Operating Margin
2015 2016 % change
Japan ¥ 72,487 ¥ 66,877 (7.7)%
North America 154,714 186,065 20.3
Europe 116,998 125,021 6.9
Asia 1,050,490 1,107,669 5.4
Other Regions 451,977 319,797 (29.2)
Total ¥1,846,666 ¥1,805,429 (2.2)%
*1 The total unit sales of completed products of Honda, its consolidated subsidiaries and
its affiliates and joint ventures accounted for using the equity method
*2 The total unit sales of completed products of Honda and its consolidated subsidiaries
Honda Group
Unit Sales*1 /
Consolidated
Unit Sales*2
(Thousands)
Sales Revenue
by Region
Yen (millions)
U.S. GAAP IFRS
U.S. GAAP IFRS
Yen (billions) (%)
2015 2016 2015 2016
500
1,500
2,000
012 13 14 15 16
50
150
1,000 100
200
0
Sales Revenue / Operating Profit
Yen (billions)
Sales Revenue (left scale) Operating Profit (right scale)
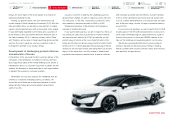
CRF1000L Africa Twin
(Europe)
Honda Motor Co., Ltd. Annual Report 2016 12
5Review of
Operations
Return to last
page opened
Go to
contents page
2Financial Highlights
3To Our Shareholders
4CFO Interview
6Corporate
Governance
7Financial Section
8Investor Relations
Information
1The Power of
Dreams