Honda 2016 Annual Report Download - page 26
Download and view the complete annual report
Please find page 26 of the 2016 Honda annual report below. You can navigate through the pages in the report by either clicking on the pages listed below, or by using the keyword search tool below to find specific information within the annual report.-
 1
1 -
2
-
3
-
4
-
5
-
6
-
7
-
8
-
9
-
10
-
11
-
12
-
13
-
14
-
15
-
 16
16 -
 17
17 -
 18
18 -
 19
19 -
 20
20 -
 21
21 -
 22
22 -
 23
23 -
 24
24 -
 25
25 -
 26
26 -
 27
27 -
 28
28 -
 29
29 -
 30
30 -
 31
31 -
 32
32 -
 33
33 -
 34
34 -
 35
35 -
 36
36 -
37
-
38
-
39
-
40
 |
 |

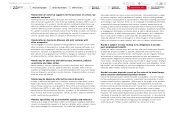
Financial Section: Financial Review
In the fiscal year ended March 31, 2015, we changed the basis of the accounting
principles used to prepare our consolidated financial statements from U.S. GAAP
to IFRS. Accordingly, the consolidated financial statements of the Company in this
Annual Report have been prepared in accordance with IFRS, as issued by IASB.
Operating and Financial Review
Sales Revenue
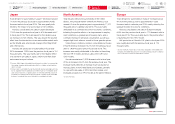
Honda’s consolidated sales revenue for the fiscal year ended March 31, 2016,
increased by ¥1,273.0 billion, or 9.6%, to ¥14,601.1 billion from the fiscal year
ended March 31, 2015, due mainly to increased sales revenue in the Automobile
business and Financial services business operations. Honda estimates that by
applying Japanese yen exchange rates of the previous fiscal year to the current
fiscal year, sales revenue for the year would have increased by approximately
¥853.9 billion, or 6.4%, compared to the increase as reported of ¥1,273.0 billion,
which includes positive foreign currency translation effects.
Operating Costs and Expenses
Operating costs and expenses increased by ¥1,440.2 billion, or 11.4%, to
¥14,097.7 billion from the previous fiscal year. Cost of sales increased by
¥1,001.6 billion, or 9.7%, to ¥11,332.3 billion from the previous fiscal year, due
mainly to an increase in costs attributable to increased consolidated unit sales in
the Automobile business. Selling, general and administrative expenses increased
by ¥388.3 billion, or 22.6%, to ¥2,108.8 billion from the previous fiscal year, due
mainly to increased product warranty expenses. Product warranty expenses
include expenses related to airbag inflators. Research and development expenses
increased by ¥50.3 billion, or 8.3%, to ¥656.5 billion from the previous fiscal year.
Operating Profit
Operating profit decreased by ¥167.2 billion, or 24.9%, to ¥503.3 billion from the
previous fiscal year, due mainly to an increase in selling, general and administrative
expenses including product warranty expenses and negative foreign currency
effects, which was partially offset by an increase in profit attributable to increased
sales revenue and model mix as well as continuing cost reduction. Honda esti-
mates that by excluding negative foreign currency effects of approximately ¥60.1
billion, operating profit would have decreased by approximately ¥107.0 billion.
(With respect to the discussion above of the changes, management identified
factors and used what it believes to be a reasonable method to analyze the
respective changes in such factors. Management analyzed changes in these
factors at the levels of the Company and its material consolidated subsidiaries.
“Foreign currency effects” consist of “translation adjustments”, which come from
the translation of the currency of foreign subsidiaries’ financial statements into
Japanese yen, and “foreign currency adjustments”, which result from foreign-
currency-denominated sales. With respect to “foreign currency adjustments”,
management analyzed foreign currency adjustments primarily related to the
following currencies: U.S. dollar, Japanese yen and others at the level of the
Company and its material consolidated subsidiaries.)
Profit before Income Taxes
Profit before income taxes decreased by ¥170.7 billion, or 21.2%, to ¥635.4
billion. The main factors behind this decrease, except factors relating to operating
profit, are as follows:
Share of profit of investments accounted for using the equity method had a
positive impact of ¥29.9 billion, due mainly to an increase in profit attributable to
increased sales revenue at affiliates and joint ventures in Asia, which was partially
offset by a recognition of impairment loss on certain investments accounted for
using the equity method.
Finance income and finance costs had a negative impact of ¥33.4 billion, due
mainly to a decrease in gains on foreign exchange.
Income Tax Expense
Income tax expense decreased by ¥16.0 billion, or 6.5%, to ¥229.0 billion from
the previous fiscal year. The average effective tax rate increased 5.7 percentage
points to 36.1% from the previous fiscal year.
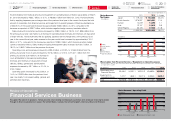
Yen (billions)
Sales Revenue
* From fiscal 2012 to 2013, the above was
named “Net Sales and Other Operating
Revenue” and stated in accordance with
U.S. GAAP.
Fiscal years ended March 31
5,000
10,000
15,000
012 13 14 15 16
U.S. GAAP IFRS
Honda Motor Co., Ltd. Annual Report 2016 25
7Financial Section
Return to last
page opened
Go to
contents page
1The Power of
Dreams
2Financial Highlights
3To Our Shareholders
4CFO Interview
5Review of
Operations
6Corporate
Governance
8Investor Relations
Information