Honda 2016 Annual Report Download - page 33
Download and view the complete annual report
Please find page 33 of the 2016 Honda annual report below. You can navigate through the pages in the report by either clicking on the pages listed below, or by using the keyword search tool below to find specific information within the annual report.-
 1
1 -
2
-
3
-
4
-
5
-
6
-
7
-
8
-
9
-
10
-
11
-
12
-
13
-
14
-
15
-
16
-
17
-
18
-
19
-
20
-
21
-
22
-
 23
23 -
 24
24 -
 25
25 -
 26
26 -
 27
27 -
 28
28 -
 29
29 -
 30
30 -
 31
31 -
 32
32 -
 33
33 -
 34
34 -
 35
35 -
 36
36 -
 37
37 -
 38
38 -
 39
39 -
 40
40
 |
 |

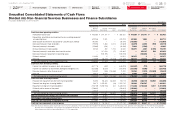
Yen (millions)
2015 2016
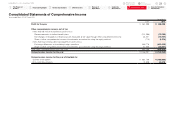
Cash flows from operating activities:
Profit before income taxes ¥ 806,237 ¥ 635,450
Depreciation, amortization and
impairment losses excluding equipment
on operating leases 625,229 660,714
Share of profit of investments accounted
for using the equity method (96,097) (126,001)
Finance income and finance costs, net (41,941) (982)
Interest income and interest costs
from financial services, net (172,275) (151,374)
Changes in assets and liabilities
Trade receivables (45,839) (88,173)
Inventories (56,285) 66,405
Trade payables 22,246 105,189
Accrued expenses 8,865 32,151
Provisions and retirement benefit liabilities 107,324 329,391
Receivables from financial services 316,962 354,353
Equipment on operating leases (535,165) (558,826)
Other assets and liabilities 45,255 20,765
Other, net (12,931) 4,851
Dividends received 114,501 105,477
Interest received 236,344 233,873
Interest paid (89,804) (92,355)
Income taxes paid, net of refund (212,222) (139,913)
Net cash provided by operating activities 1,020,404 1,390,995
Consolidated Statements of Cash Flows
Years ended March 31, 2015 and 2016
Yen (millions)
2015 2016
Cash flows from investing activities:
Payments for additions to property,
plant and equipment ¥ (648,205) ¥ (635,176)
Payments for additions to and internally
developed intangible assets (234,915) (236,783)
Proceeds from sales of property,
plant and equipment and intangible assets 33,243 25,617
Payments for acquisitions of investments
accounted for using the equity method (1,971) (3,238)
Proceeds from sales of investments
accounted for using the equity method —3,237
Payments for acquisitions of other
financial assets (108,873) (173,761)
Proceeds from sales and redemptions of
other financial assets 119,897 145,414
Other, net 328 (387)
Net cash used in investing activities (840,496) (875,077)
Cash flows from financing activities:
Proceeds from short-term financing liabilities 8,731,773 8,302,231
Repayments of short-term financing liabilities (8,602,054) (8,708,320)
Proceeds from long-term financing liabilities 1,505,732 1,826,991
Repayments of long-term financing liabilities (1,389,121) (1,267,290)
Dividends paid to owners of the parent (158,601) (158,601)
Dividends paid to non-controlling interests (21,513) (40,331)
Purchases and sales of treasury stock, net (16) (13)
Other, net (53,712) (49,966)
Net cash provided by (used in)
financing activities 12,488 (95,299)
Effect of exchange rate changes on
cash and cash equivalents 85,750 (134,893)
Net change in cash and cash equivalents 278,146 285,726
Cash and cash equivalents at
beginning of year 1,193,584 1,471,730
Cash and cash equivalents at end of year ¥ 1,471,730 ¥ 1,757,456
Honda Motor Co., Ltd. Annual Report 2016 32
7Financial Section
Return to last
page opened
Go to
contents page
1The Power of
Dreams
2Financial Highlights
3To Our Shareholders
4CFO Interview
5Review of
Operations
6Corporate
Governance
8Investor Relations
Information