Home Depot 2012 Annual Report Download - page 64
Download and view the complete annual report
Please find page 64 of the 2012 Home Depot annual report below. You can navigate through the pages in the report by either clicking on the pages listed below, or by using the keyword search tool below to find specific information within the annual report.-
 1
1 -
2
-
3
-
4
-
5
-
6
-
7
-
8
-
9
-
10
-
11
-
12
-
13
-
14
-
15
-
16
-
17
-
18
-
19
-
20
-
21
-
22
-
23
-
24
-
25
-
26
-
27
-
28
-
29
-
30
-
31
-
32
-
33
-
34
-
35
-
36
-
37
-
38
-
39
-
40
-
41
-
42
-
43
-
44
-
45
-
46
-
47
-
48
-
49
-
50
-
51
-
52
-
53
-
 54
54 -
 55
55 -
 56
56 -
 57
57 -
 58
58 -
 59
59 -
 60
60 -
 61
61 -
 62
62 -
 63
63 -
 64
64 -
 65
65 -
 66
66 -
 67
67 -
 68
68
 |
 |

F-1
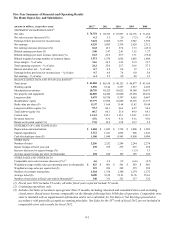
Five-Year Summary of Financial and Operating Results
The Home Depot, Inc. and Subsidiaries
amounts in millions, except where noted 2012(1) 2011 2010 2009 2008
STATEMENT OF EARNINGS DATA(2)
Net sales $ 74,754 $ 70,395 $ 67,997 $ 66,176 $ 71,288
Net sales increase (decrease) (%) 6.2 3.5 2.8 (7.2) (7.8)
Earnings before provision for income taxes 7,221 6,068 5,273 3,982 3,590
Net earnings 4,535 3,883 3,338 2,620 2,312
Net earnings increase (decrease) (%) 16.8 16.3 27.4 13.3 (45.1)
Diluted earnings per share ($) 3.00 2.47 2.01 1.55 1.37
Diluted earnings per share increase (decrease) (%) 21.5 22.9 29.7 13.1 (39.6)
Diluted weighted average number of common shares 1,511 1,570 1,658 1,692 1,686
Gross margin – % of sales 34.6 34.5 34.3 33.9 33.7
Total operating expenses – % of sales 24.2 25.0 25.7 26.6 27.5
Interest and other, net – % of sales 0.7 0.8 0.8 1.2 1.1
Earnings before provision for income taxes – % of sales 9.7 8.6 7.8 6.0 5.0
Net earnings – % of sales 6.1 5.5 4.9 4.0 3.2
BALANCE SHEET DATA AND FINANCIAL RATIOS(2)
Total assets $ 41,084 $ 40,518 $ 40,125 $ 40,877 $ 41,164
Working capital 3,910 5,144 3,357 3,537 2,209
Merchandise inventories 10,710 10,325 10,625 10,188 10,673
Net property and equipment 24,069 24,448 25,060 25,550 26,234
Long-term debt 9,475 10,758 8,707 8,662 9,667
Stockholders’ equity 17,777 17,898 18,889 19,393 17,777
Book value per share ($) 11.97 11.64 11.64 11.42 10.48
Long-term debt-to-equity (%) 53.3 60.1 46.1 44.7 54.4
Total debt-to-equity (%) 60.7 60.3 51.6 49.9 64.3
Current ratio 1.34:1 1.55:1 1.33:1 1.34:1 1.20:1
Inventory turnover 4.5x 4.3x 4.1x 4.1x 4.0x
Return on invested capital (%) 17.0 14.9 12.8 10.7 9.5
STATEMENT OF CASH FLOWS DATA
Depreciation and amortization $ 1,684 $ 1,682 $ 1,718 $ 1,806 $ 1,902
Capital expenditures 1,312 1,221 1,096 966 1,847
Cash dividends per share ($) 1.160 1.040 0.945 0.900 0.900
STORE DATA
Number of stores 2,256 2,252 2,248 2,244 2,274
Square footage at fiscal year-end 235 235 235 235 238
Increase (decrease) in square footage (%) —— — (1.3) 1.3
Average square footage per store (in thousands) 104 104 105 105 105
STORE SALES AND OTHER DATA
Comparable store sales increase (decrease) (%)(3) 4.6 3.4 2.9 (6.6) (8.7)
Weighted average weekly sales per operating store (in thousands) $ 627 $ 601 $ 581 $ 563 $ 601
Weighted average sales per square foot ($) 319 299 289 279 298
Number of customer transactions 1,364 1,318 1,306 1,274 1,272
Average ticket ($) 54.89 53.28 51.93 51.76 55.61
Number of associates at fiscal year-end (in thousands)(2) 340 331 321 317 322
(1) Fiscal year 2012 includes 53 weeks; all other fiscal years reported include 52 weeks.
(2) Continuing operations only.
(3) Includes Net Sales at locations open greater than 12 months, including relocated and remodeled stores and excluding
closed stores. Retail stores become comparable on the Monday following their 365th day of operation. Comparable store
sales is intended only as supplemental information and is not a substitute for Net Sales or Net Earnings presented in
accordance with generally accepted accounting principles. Net Sales for the 53rd week of fiscal 2012 are not included in
comparable store sales results for fiscal 2012.