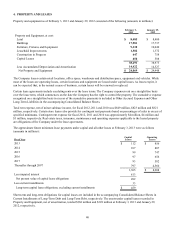
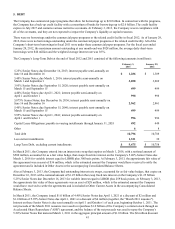
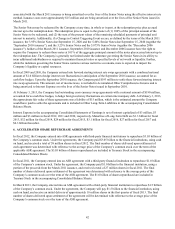
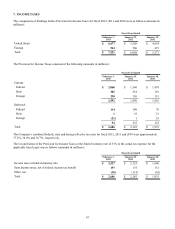
Home Depot 2012 Annual Report Download - page 39
Download and view the complete annual report
Please find page 39 of the 2012 Home Depot annual report below. You can navigate through the pages in the report by either clicking on the pages listed below, or by using the keyword search tool below to find specific information within the annual report.-
 1
1 -
2
-
3
-
4
-
5
-
6
-
7
-
8
-
9
-
10
-
11
-
12
-
13
-
14
-
15
-
16
-
17
-
18
-
19
-
20
-
21
-
22
-
23
-
24
-
25
-
26
-
27
-
28
-
 29
29 -
 30
30 -
 31
31 -
 32
32 -
 33
33 -
 34
34 -
 35
35 -
 36
36 -
 37
37 -
 38
38 -
 39
39 -
 40
40 -
 41
41 -
 42
42 -
 43
43 -
 44
44 -
 45
45 -
 46
46 -
 47
47 -
 48
48 -
 49
49 -
50
-
51
-
52
-
53
-
54
-
55
-
56
-
57
-
58
-
59
-
60
-
61
-
62
-
63
-
64
-
65
-
66
-
67
-
68
 |
 |

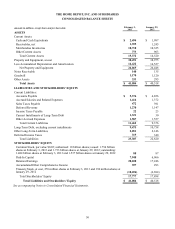
33
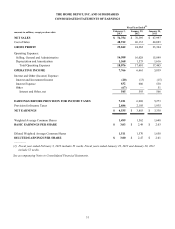
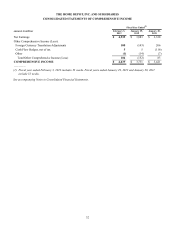
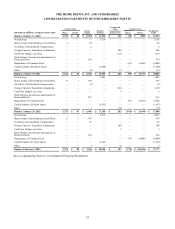
THE HOME DEPOT, INC. AND SUBSIDIARIES
CONSOLIDATED STATEMENTS OF STOCKHOLDERS’ EQUITY
Accumulated
Other
Comprehensive
Income (Loss)
Common Stock Paid-In
Capital Retained
Earnings
Treasury Stock Stockholders’
Equity
amounts in millions, except per share data Shares Amount Shares Amount
Balance, January 31, 2010 1,716 $ 86 $ 6,304 $ 13,226 $ 362 (18) $ (585) $ 19,393
Net Earnings — — — 3,338 — — — 3,338
Shares Issued Under Employee Stock Plans 6 — 42 — — — — 42
Tax Effect of Stock-Based Compensation — — 2 — — — — 2
Foreign Currency Translation Adjustments — — — — 206 — — 206
Cash Flow Hedges, net of tax — — — — (116) — — (116)
Stock Options, Awards and Amortization of
Restricted Stock — — 214 — — — — 214
Repurchases of Common Stock — — — — — (81) (2,608) (2,608)
Cash Dividends ($0.945 per share) — — — (1,569) — — — (1,569)
Other — — (6) — (7) — — (13)
Balance, January 30, 2011 1,722 $ 86 $ 6,556 $ 14,995 $ 445 (99) $ (3,193) $ 18,889
Net Earnings — — — 3,883 — — — 3,883
Shares Issued Under Employee Stock Plans 11 1 196 — — — — 197
Tax Effect of Stock-Based Compensation — — (2) — — — — (2)
Foreign Currency Translation Adjustments — — — — (143) — — (143)
Cash Flow Hedges, net of tax — — — — 5 — — 5
Stock Options, Awards and Amortization of
Restricted Stock — — 215 — — — — 215
Repurchases of Common Stock — — — — — (97) (3,501) (3,501)
Cash Dividends ($1.04 per share) — — — (1,632) — — — (1,632)
Other — — 1 — (14) — — (13)
Balance, January 29, 2012 1,733 $ 87 $ 6,966 $ 17,246 $ 293 (196) $ (6,694) $ 17,898
Net Earnings — — — 4,535 — — — 4,535
Shares Issued Under Employee Stock Plans 21 1 678 — — — — 679
Tax Effect of Stock-Based Compensation — — 82 — — — — 82
Foreign Currency Translation Adjustments — — — — 100 — — 100
Cash Flow Hedges, net of tax — — — — 5 — — 5
Stock Options, Awards and Amortization of
Restricted Stock — — 218 — — — — 218
Repurchases of Common Stock — — — — — (74) (4,000) (4,000)
Cash Dividends ($1.16 per share) — — — (1,743) — — — (1,743)
Other — — 4 — (1) — — 3
Balance, February 3, 2013 1,754 $ 88 $ 7,948 $ 20,038 $ 397 (270) $ (10,694) $ 17,777
See accompanying Notes to Consolidated Financial Statements.