Home Depot 2012 Annual Report Download - page 26
Download and view the complete annual report
Please find page 26 of the 2012 Home Depot annual report below. You can navigate through the pages in the report by either clicking on the pages listed below, or by using the keyword search tool below to find specific information within the annual report.-
 1
1 -
2
-
3
-
4
-
5
-
6
-
7
-
8
-
9
-
10
-
11
-
12
-
13
-
14
-
15
-
 16
16 -
 17
17 -
 18
18 -
 19
19 -
 20
20 -
 21
21 -
 22
22 -
 23
23 -
 24
24 -
 25
25 -
 26
26 -
 27
27 -
 28
28 -
 29
29 -
 30
30 -
 31
31 -
 32
32 -
 33
33 -
 34
34 -
 35
35 -
 36
36 -
37
-
38
-
39
-
40
-
41
-
42
-
43
-
44
-
45
-
46
-
47
-
48
-
49
-
50
-
51
-
52
-
53
-
54
-
55
-
56
-
57
-
58
-
59
-
60
-
61
-
62
-
63
-
64
-
65
-
66
-
67
-
68
 |
 |

20
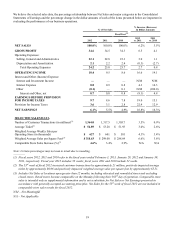
Results of Operations
For an understanding of the significant factors that influenced our performance during the past three fiscal years, the
following discussion should be read in conjunction with the Consolidated Financial Statements and the Notes to Consolidated
Financial Statements presented in this report.
Fiscal 2012 Compared to Fiscal 2011
Net Sales
Fiscal 2012 consisted of 53 weeks compared to 52 weeks in fiscal 2011. Net Sales for fiscal 2012 increased 6.2% to $74.8
billion from $70.4 billion for fiscal 2011. The increase in Net Sales for fiscal 2012 reflects the impact of positive comparable
store sales and $1.2 billion of Net Sales attributable to the additional week in fiscal 2012. Total comparable store sales
increased 4.6% for fiscal 2012 compared to an increase of 3.4% for fiscal 2011.
The positive comparable store sales for fiscal 2012 reflect a number of factors including the execution of our key initiatives
and an improved U.S. housing market. All of our departments except for one posted positive comparable store sales for fiscal
2012, and comparable store average ticket increased 2.9% for fiscal 2012. Comparable store sales for our Lumber, Flooring,
Paint, Tools, Bath, Electrical, Lighting, Indoor Garden and Décor product categories were above or at the Company average
for fiscal 2012. Comparable store sales for our Hardware, Plumbing, Outdoor Garden, Kitchen and Millwork product
categories were positive for fiscal 2012. Comparable store sales for our Building Materials product category were negative
for fiscal 2012, reflecting the impact of weather and difficult year-over-year comparisons in roofing due to storm and repair
activity that drove sales in fiscal 2011.
Gross Profit
Gross Profit increased 6.5% to $25.8 billion for fiscal 2012 from $24.3 billion for fiscal 2011. Gross Profit for fiscal 2012
included a $10 million charge related to the China store closings. Gross Profit as a percent of Net Sales was 34.6% for fiscal
2012 compared to 34.5% for fiscal 2011, an increase of 10 basis points. The increase in gross profit margin in fiscal 2012 was
driven primarily by a change in mix of products sold and benefits from our supply chain transformation in the U.S.
Operating Expenses
Selling, General and Administrative expenses ("SG&A") increased 3.0% to $16.5 billion for fiscal 2012 from $16.0 billion
for fiscal 2011. SG&A for fiscal 2012 included a $135 million charge related to the China store closings. As a percent of Net
Sales, SG&A was 22.1% for fiscal 2012 compared to 22.8% for fiscal 2011. Excluding the charge related to the China store
closings, SG&A as a percent of Net Sales was 21.9% for fiscal 2012. The decrease in SG&A as a percent of Net Sales for
fiscal 2012 reflects expense leverage resulting from the positive comparable store sales environment, strong expense controls,
and lower credit card expense and casualty reserves, offset by the charge related to the China store closings.
Depreciation and Amortization was $1.6 billion for both fiscal 2012 and 2011. Depreciation and Amortization as a percent of
Net Sales was 2.1% for fiscal 2012 compared to 2.2% for fiscal 2011. The decrease in Depreciation and Amortization as a
percent of Net Sales reflects expense leverage in the positive comparable store sales environment.
Operating Income
Operating Income increased 16.6% to $7.8 billion for fiscal 2012 from $6.7 billion for fiscal 2011. Operating Income as a
percent of Net Sales was 10.4% for fiscal 2012 compared to 9.5% for fiscal 2011. Excluding the charges related to the China
store closings, Operating Income increased 18.8% to $7.9 billion for fiscal 2012.
Interest and Other, net
In fiscal 2012, we recognized $545 million of Interest and Other, net, compared to $593 million for fiscal 2011. Interest and
Other, net, as a percent of Net Sales was 0.7% for fiscal 2012 compared to 0.8% for fiscal 2011. Interest and Other, net, for
fiscal 2012 included a $67 million pretax benefit related to the termination of our guarantee of a senior secured loan of HD
Supply, Inc. ("HD Supply Guarantee").
Provision for Income Taxes
Our combined effective income tax rate was 37.2% for fiscal 2012 compared to 36.0% for fiscal 2011. The effective income
tax rate for fiscal 2012 was higher than fiscal 2011 as we were unable to realize any tax benefit from the $145 million of
charges related to the China store closings. Excluding the charges related to the China store closings, our combined effective
income tax rate was 36.5% for fiscal 2012. Additionally, the effective income tax rate for fiscal 2011 reflects a benefit from