Home Depot 2012 Annual Report Download - page 11
Download and view the complete annual report
Please find page 11 of the 2012 Home Depot annual report below. You can navigate through the pages in the report by either clicking on the pages listed below, or by using the keyword search tool below to find specific information within the annual report.-
 1
1 -
 2
2 -
 3
3 -
 4
4 -
 5
5 -
 6
6 -
 7
7 -
 8
8 -
 9
9 -
 10
10 -
 11
11 -
 12
12 -
 13
13 -
 14
14 -
 15
15 -
 16
16 -
 17
17 -
 18
18 -
 19
19 -
 20
20 -
 21
21 -
 22
22 -
23
-
24
-
25
-
26
-
27
-
28
-
29
-
30
-
31
-
32
-
33
-
34
-
35
-
36
-
37
-
38
-
39
-
40
-
41
-
42
-
43
-
44
-
45
-
46
-
47
-
48
-
49
-
50
-
51
-
52
-
53
-
54
-
55
-
56
-
57
-
58
-
59
-
60
-
61
-
62
-
63
-
64
-
65
-
66
-
67
-
68
 |
 |

5
Net Sales of Major Product Groups. The following table shows the percentage of Net Sales of each major product group
(and related services) for each of the last three fiscal years:
Product Group
Percentage of Net Sales for Fiscal Year Ended
February 3,
2013 January 29,
2012 January 30,
2011
Plumbing, electrical and kitchen 30.8% 30.5% 30.0%
Hardware and seasonal 29.4 29.5 29.4
Building materials, lumber and millwork 20.6 21.1 21.7
Paint and flooring 19.2 18.9 18.9
Total 100.0% 100.0% 100.0%
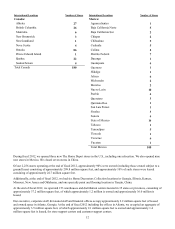
Net Sales outside the U.S. were $8.4 billion, $8.0 billion and $7.5 billion for fiscal 2012, 2011 and 2010, respectively. Long-
lived assets outside the U.S. totaled $3.1 billion, $3.1 billion and $3.2 billion as of February 3, 2013, January 29, 2012 and
January 30, 2011, respectively.
Seasonality. Our business is subject to seasonal influences. Generally, our highest volume of sales occurs in our second
fiscal quarter, and the lowest volume occurs during our fourth fiscal quarter. Fiscal 2012 included 53 weeks, rather than 52
weeks. As a result, our fourth fiscal quarter in 2012 included an extra week, which increased sales for that quarter.
Competition. Our industry is highly competitive, with competition based primarily on customer service, price, store location
and appearance, and quality, availability and assortment of merchandise. Although we are currently the world’s largest home
improvement retailer, in each of the markets we serve there are a number of other home improvement stores, electrical,
plumbing and building materials supply houses and lumber yards. With respect to some products and services, we also
compete with specialty design stores, showrooms, discount stores, local, regional and national hardware stores, mail order
firms, warehouse clubs, independent building supply stores and, to a lesser extent, other retailers, as well as with installers of
home improvement products. In addition, we face growing competition from online and multichannel retailers.
Intellectual Property. Our business has one of the most recognized brands in North America. As a result, we believe that
The Home Depot® trademark has significant value and is an important factor in the marketing of our products, e-commerce,
stores and business. We have registered or applied for registration of trademarks, service marks, copyrights and internet
domain names, both domestically and internationally, for use in our business. We also maintain patent portfolios relating to
some of our products and services and seek to patent or otherwise protect innovations we incorporate into our products or
business operations.
Disciplined Capital Allocation, Productivity and Efficiency
Logistics. Our supply chain operations are focused on creating a competitive advantage through ensuring product
availability for our customers, effectively using our investment in inventory, and managing total supply chain costs. Our
fiscal 2012 initiatives have been to further optimize and efficiently operate our network, build new logistics capabilities and
improve our inventory management systems and processes.
Our distribution strategy is to provide the optimal flow path for a given product. RDCs play a key role in optimizing our
network as they allow for aggregation of product needs for multiple stores to a single purchase order and then rapid allocation
and deployment of inventory to individual stores upon arrival at the RDC. This results in a simplified ordering process and
improved transportation and inventory management. To enhance our RDC network, we continued adding mechanization, and
at the end of fiscal 2012, all 18 of our U.S. RDCs were mechanized. We also expanded our U.S. transload program for
imported products to four facilities operated by third parties near ocean ports. Transload facilities allow us to improve our
import logistics costs and inventory management by enabling imported product to flow through our RDC network.
Over the past several years, we have centralized our inventory planning and replenishment function and implemented new
forecasting and replenishment technology. This has helped us to improve our in-stock rates and our inventory productivity at
the same time. At the end of fiscal 2012, over 91% of our U.S. store products were ordered through central replenishment.
In addition to our 18 RDCs in the U.S., at the end of fiscal 2012, we operated 33 bulk distribution centers, which handle
products distributed optimally on flat bed trucks, in the U.S. and Canada. We also operated 36 conventional distribution
centers, which include stocking, direct fulfillment and specialty distribution centers, in the U.S., Canada and Mexico. We
remain committed to leveraging our supply chain capabilities to fully utilize and optimize our improved logistics network.