Home Depot 2012 Annual Report Download - page 27
Download and view the complete annual report
Please find page 27 of the 2012 Home Depot annual report below. You can navigate through the pages in the report by either clicking on the pages listed below, or by using the keyword search tool below to find specific information within the annual report.-
 1
1 -
2
-
3
-
4
-
5
-
6
-
7
-
8
-
9
-
10
-
11
-
12
-
13
-
14
-
15
-
16
-
 17
17 -
 18
18 -
 19
19 -
 20
20 -
 21
21 -
 22
22 -
 23
23 -
 24
24 -
 25
25 -
 26
26 -
 27
27 -
 28
28 -
 29
29 -
 30
30 -
 31
31 -
 32
32 -
 33
33 -
 34
34 -
 35
35 -
 36
36 -
 37
37 -
38
-
39
-
40
-
41
-
42
-
43
-
44
-
45
-
46
-
47
-
48
-
49
-
50
-
51
-
52
-
53
-
54
-
55
-
56
-
57
-
58
-
59
-
60
-
61
-
62
-
63
-
64
-
65
-
66
-
67
-
68
 |
 |

21
the reversal of a valuation allowance related to the utilization of capital loss carryforwards as well as certain favorable state
and local tax settlements.
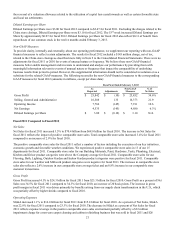
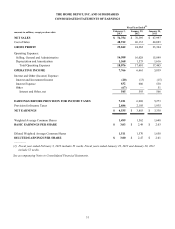
Diluted Earnings per Share
Diluted Earnings per Share were $3.00 for fiscal 2012 compared to $2.47 for fiscal 2011. Excluding the charges related to the
China store closings, Diluted Earnings per Share were $3.10 for fiscal 2012. The 53rd week increased Diluted Earnings per
Share by approximately $0.07 for fiscal 2012. Diluted Earnings per Share for fiscal 2012 also reflect $0.11 of benefit from
repurchases of our common stock in the twelve months ended February 3, 2013.
Non-GAAP Measures
To provide clarity, internally and externally, about our operating performance, we supplement our reporting with non-GAAP
financial measures to reflect certain adjustments. The results for fiscal 2012 included a $145 million charge, net of tax,
related to the China store closings as described more fully in Note 2 to the Consolidated Financial Statements. There were no
adjustments for fiscal 2011 or 2010 for events of unusual nature or frequency. We believe these non-GAAP financial
measures better enable management and investors to understand and analyze our performance by providing them with
meaningful information relevant to events of unusual nature or frequency that impact the comparability of underlying
business results from period to period. However, this supplemental information should not be considered in isolation or as a
substitute for the related GAAP measures. The following reconciles the non-GAAP financial measures to the corresponding
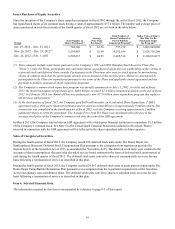
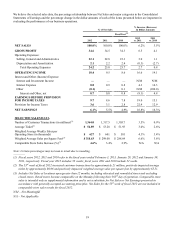
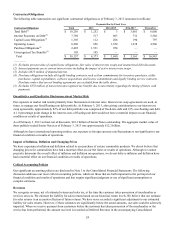
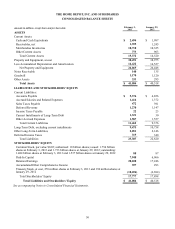
GAAP measures for fiscal 2012 (amounts in millions, except per share data):
Fiscal Year Ended February 3, 2013
As
Reported Adjustments Non-GAAP
Measures % of
Net Sales
Gross Profit $ 25,842 $ (10) $ 25,852 34.6%
Selling, General and Administrative 16,508 135 16,373 21.9
Operating Income 7,766 (145) 7,911 10.6
Net Earnings 4,535 (145) 4,680 6.3%
Diluted Earnings per Share $ 3.00 $ (0.10) $ 3.10 N/A
Fiscal 2011 Compared to Fiscal 2010
Net Sales
Net Sales for fiscal 2011 increased 3.5% to $70.4 billion from $68.0 billion for fiscal 2010. The increase in Net Sales for
fiscal 2011 reflects the impact of positive comparable store sales. Total comparable store sales increased 3.4% for fiscal 2011
compared to an increase of 2.9% for fiscal 2010.
The positive comparable store sales for fiscal 2011 reflect a number of factors including the execution of our key initiatives,
economic growth and favorable weather conditions. We experienced positive comparable store sales in 13 of our 15
departments for fiscal 2011. Comparable store sales for our Building Materials, Paint, Hardware, Tools, Plumbing, Electrical,
Kitchen and Décor product categories were above the Company average for fiscal 2011. Comparable store sales for our
Flooring, Bath, Lighting, Outdoor Garden and Indoor Garden product categories were positive for fiscal 2011. Comparable
store sales for our Lumber and Millwork product categories were negative for fiscal 2011. The increase in comparable store
sales also reflects a 2.6% increase in our comparable store average ticket and an 0.8% increase in our comparable store
customer transactions.
Gross Profit
Gross Profit increased 4.1% to $24.3 billion for fiscal 2011 from $23.3 billion for fiscal 2010. Gross Profit as a percent of Net
Sales was 34.5% for fiscal 2011 compared to 34.3% for fiscal 2010, an increase of 20 basis points. The increase in gross
profit margin in fiscal 2011 was driven primarily by benefits arising from our supply chain transformation in the U.S., which
was partially offset by higher shrink compared to fiscal 2010.
Operating Expenses
SG&A increased 1.1% to $16.0 billion for fiscal 2011 from $15.8 billion for fiscal 2010. As a percent of Net Sales, SG&A
was 22.8% for fiscal 2011 compared to 23.3% for fiscal 2010. The decrease in SG&A as a percent of Net Sales for fiscal
2011 reflects expense leverage in the positive comparable store sales environment partially offset by a $32 million
impairment charge for a non-core carpet cleaning and cabinet refinishing business that was sold in fiscal 2011 and $26